USD/CAD Price Forecast: Testing range bottom, at the 1.3975 area
- The US Dollar extends losses against the CAD to test support at the 1.3975 area.
- Hopes of a Sino-US trade deal have boosted risk appetite.
- Market expectations of a Fed rate cut this week are adding pressure on the USD.

The US Dollar is on its back foot agains its Canadian counterpart on Monday. The risk-on market amid hopes of a Sino-US trade deal and the recent rally in Oil prices are weighing on the pair, which is testing the bottom of the last three weeks' trading range, at the 1.3975 area at the moment.
Positive comments coming from the meeting between US and Chinese negotiators in Malaysia this weekend have boosted hopes of a trade deal and are feeding a moderate risk appetite on Monday.
Investors’ expectations that US and China’s Presidents Donald Trump and XI Jinping will seal the deal later this week are keeping Oil prices steady at two-week highs above $61.00, underpinning support for the commodity-sensitive CAD. On the other hand, market expectations that the Federal Reserve will cut rates by 25 basis points on Wednesday are keeping the US Dollar under mild bearish pressure.
Technical Analysis: Supports are at 1.3975 and then 1.3935
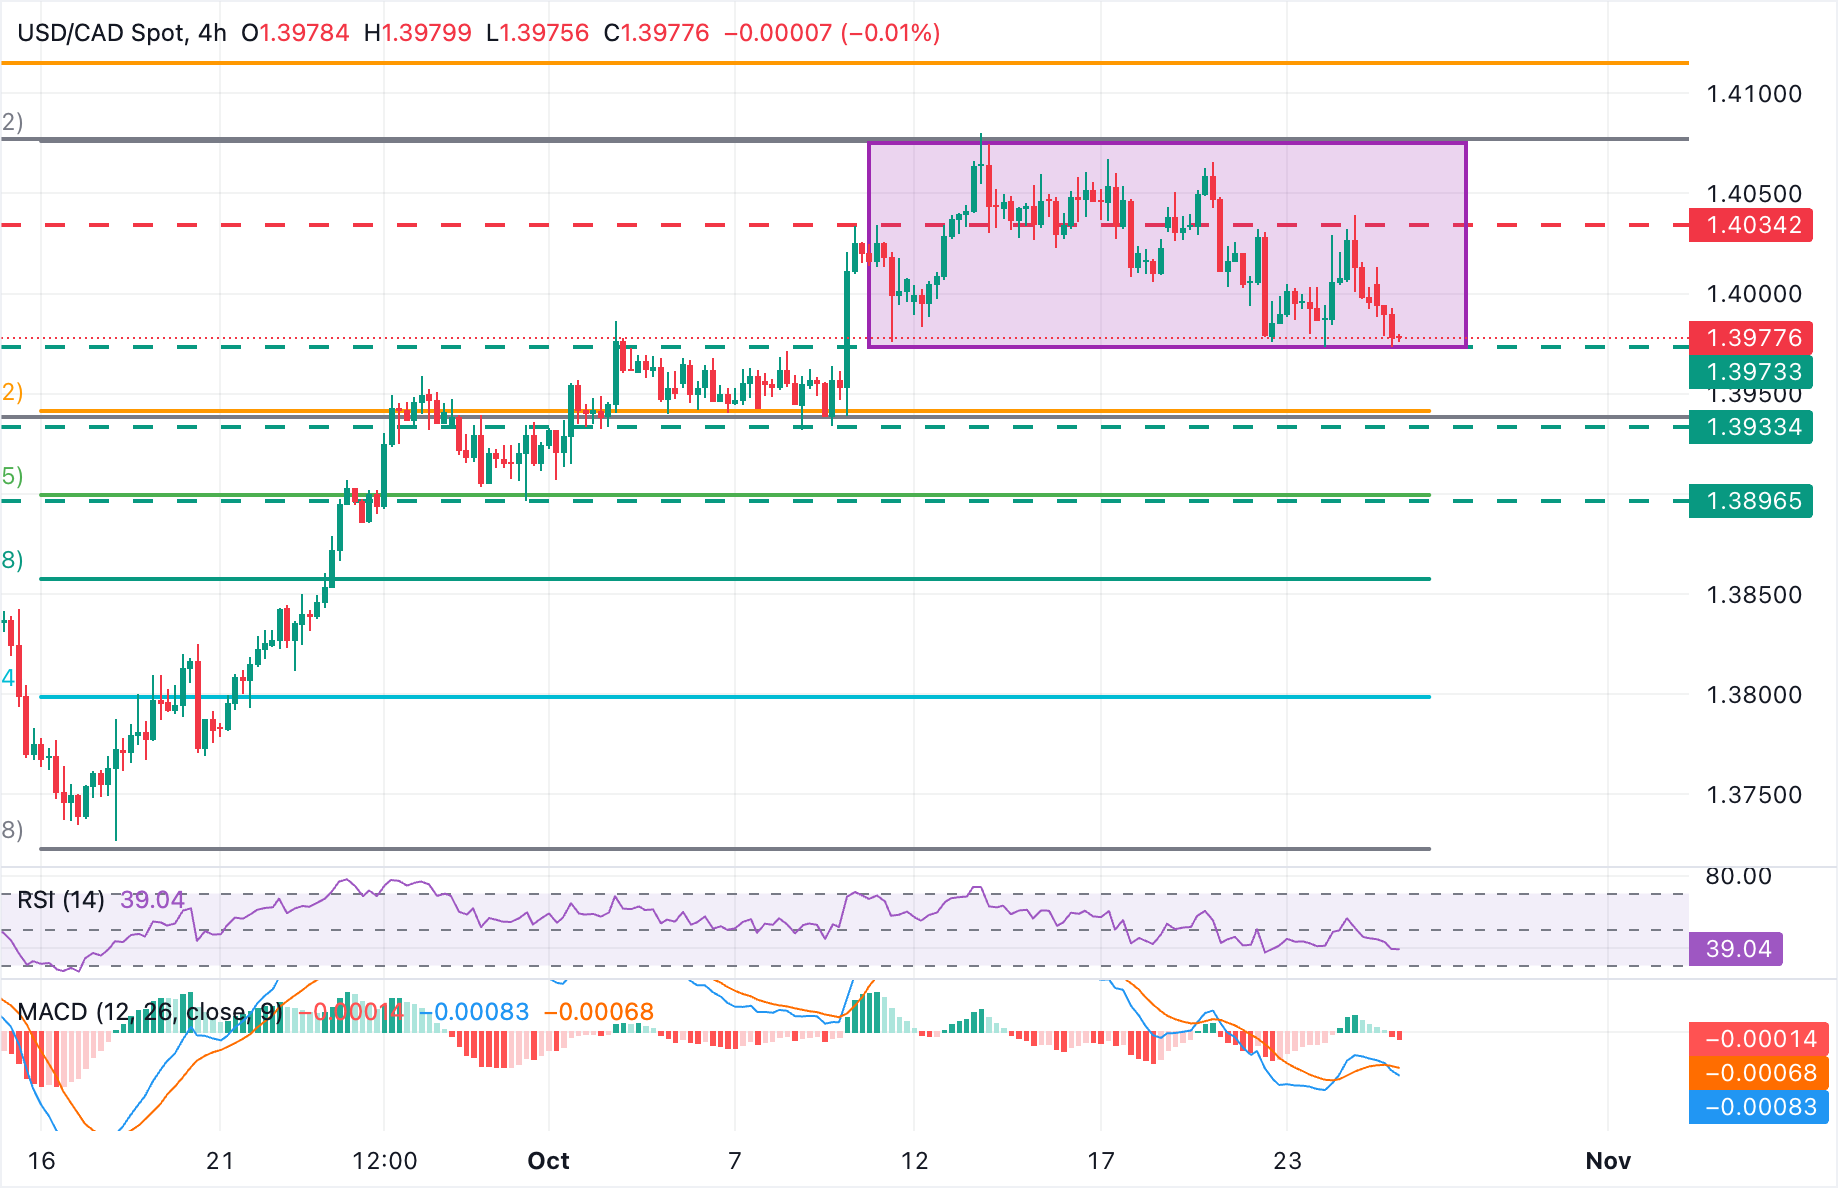
The technical picture shows the pair under growing pressure, with bears testing the bottom of the horizontal channel formed over the last three weeks, at the 1.3975 area. The 4-Hour Relative Strength Index (RSI) has breached the 50 level, and the Moving Average Convergence Divergence has crossed below its signal line, suggesting further decline is on the cards.
A confirmation below the mentioned 1.3975 (October 10, 22, and 23 lows) brings the 38.2% Fibonacci retracement, at 1.3943, and the October 8 low, at 1.3335, to the focus. Further down, the next target is the September 29 and 30 lows, in the area of 1.3885.
A bullish reaction from current levels, on the other hand, is likely to be challenged at the 1.4035, October 22, and October 24 highs, ahead of the October 14 high, right below 1.4080. Further up, the 1.27% Fibonacci extension of the early October rally is at 1.4115.
US Dollar Price Today
The table below shows the percentage change of US Dollar (USD) against listed major currencies today. US Dollar was the strongest against the Swiss Franc.
| USD | EUR | GBP | JPY | CAD | AUD | NZD | CHF | |
|---|---|---|---|---|---|---|---|---|
| USD | 0.00% | -0.09% | 0.02% | -0.13% | -0.41% | -0.18% | 0.09% | |
| EUR | -0.01% | -0.06% | 0.02% | -0.12% | -0.38% | -0.18% | 0.13% | |
| GBP | 0.09% | 0.06% | 0.08% | -0.05% | -0.31% | -0.12% | 0.19% | |
| JPY | -0.02% | -0.02% | -0.08% | -0.15% | -0.44% | -0.19% | 0.09% | |
| CAD | 0.13% | 0.12% | 0.05% | 0.15% | -0.28% | -0.05% | 0.26% | |
| AUD | 0.41% | 0.38% | 0.31% | 0.44% | 0.28% | 0.20% | 0.51% | |
| NZD | 0.18% | 0.18% | 0.12% | 0.19% | 0.05% | -0.20% | 0.29% | |
| CHF | -0.09% | -0.13% | -0.19% | -0.09% | -0.26% | -0.51% | -0.29% |
The heat map shows percentage changes of major currencies against each other. The base currency is picked from the left column, while the quote currency is picked from the top row. For example, if you pick the US Dollar from the left column and move along the horizontal line to the Japanese Yen, the percentage change displayed in the box will represent USD (base)/JPY (quote).
Author

Guillermo Alcala
FXStreet
Graduated in Communication Sciences at the Universidad del Pais Vasco and Universiteit van Amsterdam, Guillermo has been working as financial news editor and copywriter in diverse Forex-related firms, like FXStreet and Kantox.


