USD/CAD Price Forecast: Could test 1.4200 barrier near nine-day EMA
- USD/CAD trades within a falling wedge pattern, a bullish formation that indicates a potential breakout to the upside.
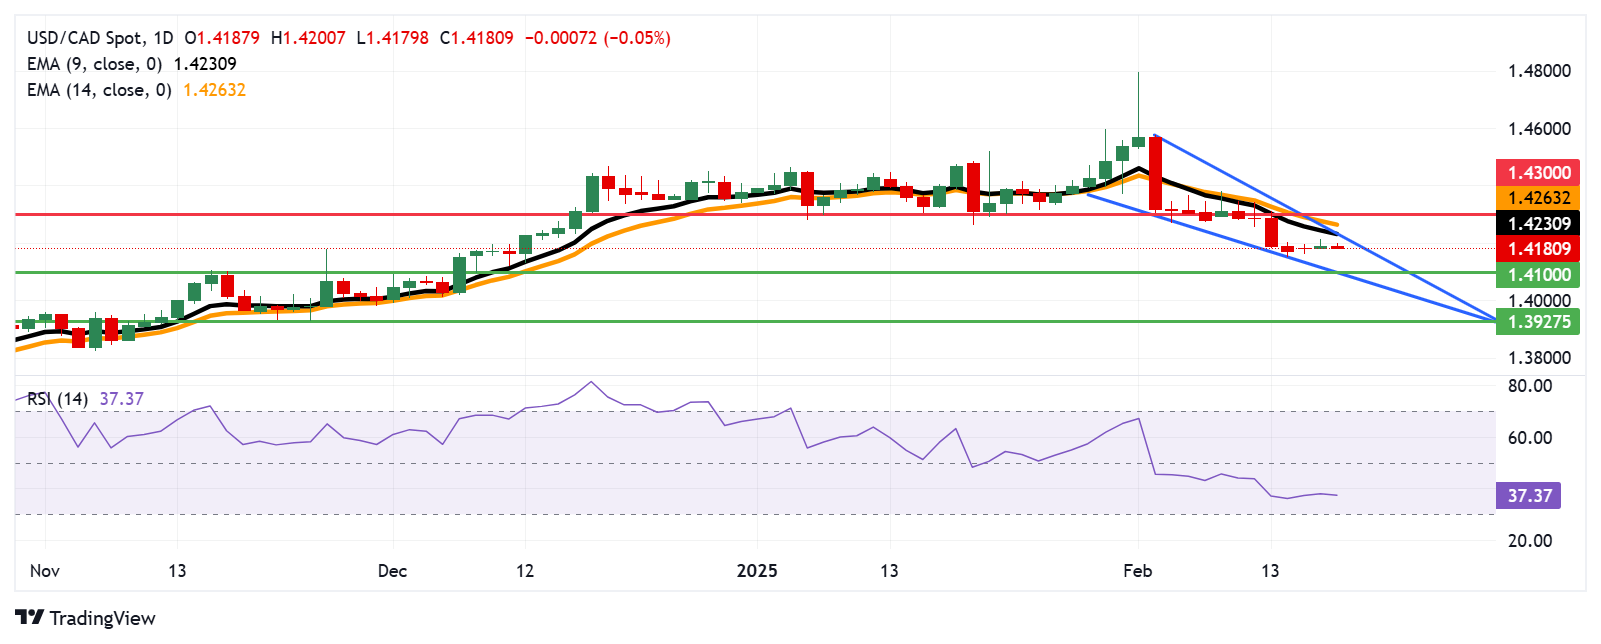
- The pair could find immediate support around the falling wedge’s lower boundary at 1.4100.
- The immediate resistance zone appears near the nine-day EMA at 1.4230, aligned with the upper boundary of the falling wedge.

The USD/CAD pair gives up its recent gains from the previous session, trading near 1.4180 during Asian hours on Wednesday. Technical analysis on the daily chart suggests a falling wedge pattern, a bullish formation that suggests a potential breakout to the upside.
Additionally, the 14-day Relative Strength Index (RSI) remains above the 30 level, supporting the current bearish outlook. However, a decline below 30 would indicate oversold conditions for the USD/CAD pair, potentially hinting at an upcoming upward correction.
However, the USD/CAD pair remains below the nine- and 14-day Exponential Moving Averages (EMAs), indicating persistent bearish sentiment and weak short-term price action. This positioning suggests continued selling pressure.
On the downside, the USD/CAD pair may find immediate support at the lower boundary of the falling wedge, aligning with the psychological level of 1.4100. A break below this channel would strengthen the bearish bias, potentially driving the pair toward the three-month low of 1.3927, last reached on November 25.
The USD/CAD pair may encounter immediate resistance near the nine-day EMA at 1.4230, which aligns with the upper boundary of the falling wedge. A further hurdle is seen at the 14-day EMA of 1.4263. A breakout above this key resistance zone could shift the bias to bullish, potentially driving the pair toward the psychological level of 1.4300.
USD/CAD: Daily Chart
(This story was corrected on February 19 at 10:49 GMT to say that the pair could find immediate support around the falling wedge’s lower boundary at 1.4100, not the falling wedge’s higher boundary.)
Canadian Dollar PRICE Today
The table below shows the percentage change of Canadian Dollar (CAD) against listed major currencies today. Canadian Dollar was the weakest against the New Zealand Dollar.
| USD | EUR | GBP | JPY | CAD | AUD | NZD | CHF | |
|---|---|---|---|---|---|---|---|---|
| USD | -0.05% | -0.09% | -0.18% | -0.05% | -0.19% | -0.31% | -0.03% | |
| EUR | 0.05% | -0.04% | -0.11% | -0.01% | -0.15% | -0.26% | 0.01% | |
| GBP | 0.09% | 0.04% | -0.10% | 0.05% | -0.11% | -0.22% | 0.05% | |
| JPY | 0.18% | 0.11% | 0.10% | 0.11% | -0.03% | -0.16% | 0.12% | |
| CAD | 0.05% | 0.00% | -0.05% | -0.11% | -0.14% | -0.27% | 0.01% | |
| AUD | 0.19% | 0.15% | 0.11% | 0.03% | 0.14% | -0.12% | 0.16% | |
| NZD | 0.31% | 0.26% | 0.22% | 0.16% | 0.27% | 0.12% | 0.28% | |
| CHF | 0.03% | -0.01% | -0.05% | -0.12% | -0.01% | -0.16% | -0.28% |
The heat map shows percentage changes of major currencies against each other. The base currency is picked from the left column, while the quote currency is picked from the top row. For example, if you pick the Canadian Dollar from the left column and move along the horizontal line to the US Dollar, the percentage change displayed in the box will represent CAD (base)/USD (quote).
Author

Akhtar Faruqui
FXStreet
Akhtar Faruqui is a Forex Analyst based in New Delhi, India. With a keen eye for market trends and a passion for dissecting complex financial dynamics, he is dedicated to delivering accurate and insightful Forex news and analysis.


