USD/CAD Price Forecast: Challenges EMAs resistance in a bid to reach 1.3800
- USD/CAD may find initial support at the rectangle’s lower boundary around 1.3730.
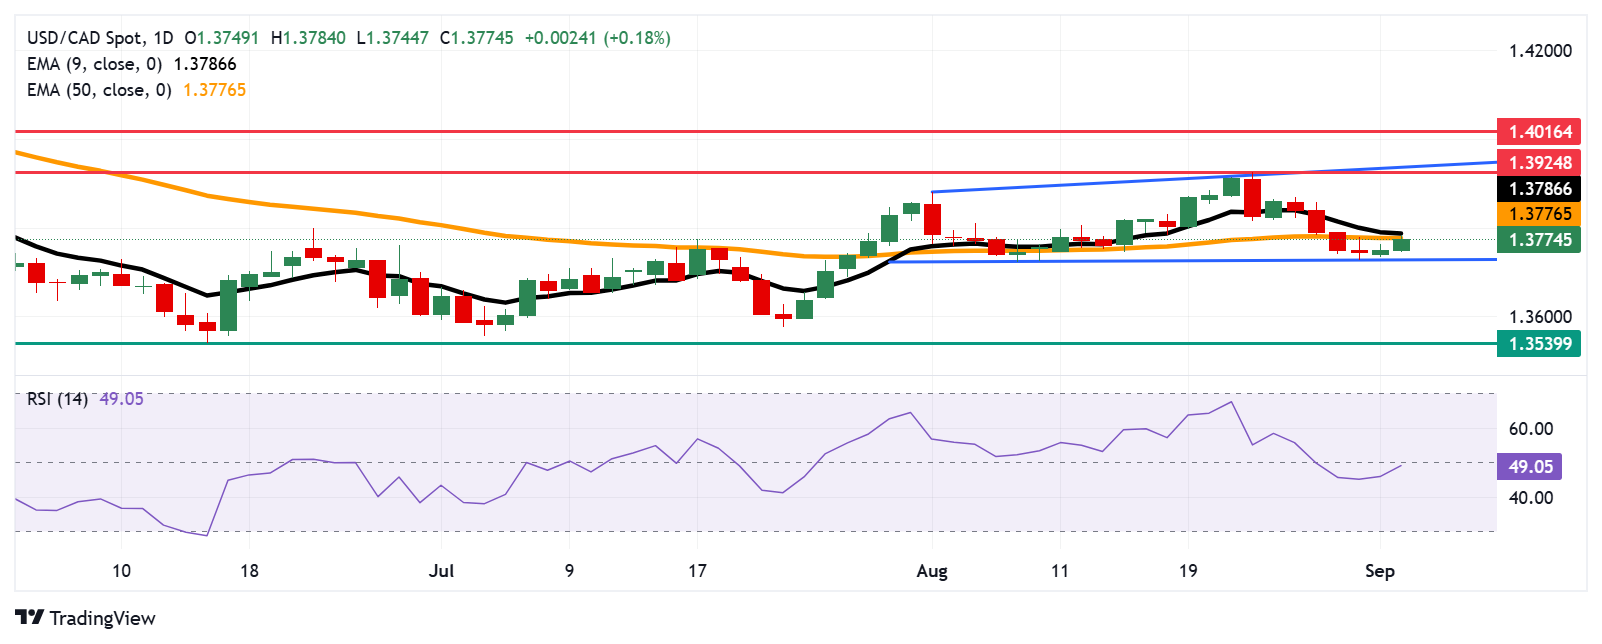
- The market outlook is bearish as the 14-day RSI remains below the 50 level.
- The pair tests the immediate resistance at the 50-day EMA of 1.3776, followed by the nine-day EMA at 1.3786.

USD/CAD continues to gain ground for the second successive session, trading around 1.3780 during the European hours on Tuesday. The technical analysis of the daily chart suggests that the pair moves sideways within a rectangular pattern, suggesting a consolidation phase.
However, the 14-day Relative Strength Index (RSI) is positioned slightly below the 50 level, indicating a bearish outlook. Further movements will offer a clear directional trend. Additionally, the USD/CAD pair is positioned below the nine-day Exponential Moving Average (EMA), suggesting the short-term price momentum is weaker.
The USD/CAD pair may find its initial support at the lower boundary of the rectangle around 1.3730, followed by the psychological level of 1.3700. A break below this crucial support zone would strengthen the bearish bias and put downward pressure on the pair to navigate the region around the 11-month low of 1.3539.
On the upside, the USD/CAD pair is testing its immediate barrier at the 50-day EMA of 1.3776, with the nine-day EMA at 1.3786 acting as the next hurdle. A successful break above this crucial resistance zone could improve the short- and medium-term price momentum and lead the pair to test the four-month high at 1.3924, which was recorded on August 22, followed by the upper boundary of the rectangle around 1.3940.
Further advances will reinforce the bullish bias and support the pair to approach the five-month high at 1.4016, which was reached on May 13.
USD/CAD: Daily Chart
Canadian Dollar Price Today
The table below shows the percentage change of Canadian Dollar (CAD) against listed major currencies today. Canadian Dollar was the weakest against the US Dollar.
| USD | EUR | GBP | JPY | CAD | AUD | NZD | CHF | |
|---|---|---|---|---|---|---|---|---|
| USD | 0.61% | 1.05% | 0.89% | 0.16% | 0.63% | 0.77% | 0.46% | |
| EUR | -0.61% | 0.43% | 0.29% | -0.44% | 0.07% | 0.17% | -0.15% | |
| GBP | -1.05% | -0.43% | -0.14% | -0.86% | -0.37% | -0.27% | -0.57% | |
| JPY | -0.89% | -0.29% | 0.14% | -0.72% | -0.26% | -0.11% | -0.38% | |
| CAD | -0.16% | 0.44% | 0.86% | 0.72% | 0.44% | 0.63% | 0.30% | |
| AUD | -0.63% | -0.07% | 0.37% | 0.26% | -0.44% | 0.11% | -0.20% | |
| NZD | -0.77% | -0.17% | 0.27% | 0.11% | -0.63% | -0.11% | -0.30% | |
| CHF | -0.46% | 0.15% | 0.57% | 0.38% | -0.30% | 0.20% | 0.30% |
The heat map shows percentage changes of major currencies against each other. The base currency is picked from the left column, while the quote currency is picked from the top row. For example, if you pick the Canadian Dollar from the left column and move along the horizontal line to the US Dollar, the percentage change displayed in the box will represent CAD (base)/USD (quote).
Author

Akhtar Faruqui
FXStreet
Akhtar Faruqui is a Forex Analyst based in New Delhi, India. With a keen eye for market trends and a passion for dissecting complex financial dynamics, he is dedicated to delivering accurate and insightful Forex news and analysis.


