USD/CAD Price Forecast: 200-EMA remains key barrier for US Dollar bulls
- USD/CAD trades firmly near 1.3850 ahead of the US PPI data for August.
- Analysts at BofA expects the BoC to cut interest rates by 25 bps to 2.5% in the policy meeting next week.
- The Loonie pair continues to face pressure near the 200-day EMA.

The USD/CAD pair holds onto gains near Tuesday’s high around 1.3850 during the late Asian trading session on Wednesday. The Loonie pair trades firmly as the Canadian Dollar (CAD) underperforms its peers amid expectations that the Bank of Canada (BoC) will quickly resume its monetary-easing campaign, which it paused in April.
Canadian Dollar Price Today
The table below shows the percentage change of Canadian Dollar (CAD) against listed major currencies today. Canadian Dollar was the weakest against the New Zealand Dollar.
| USD | EUR | GBP | JPY | CAD | AUD | NZD | CHF | |
|---|---|---|---|---|---|---|---|---|
| USD | -0.03% | -0.08% | 0.04% | -0.01% | -0.25% | -0.30% | -0.15% | |
| EUR | 0.03% | -0.05% | 0.02% | 0.02% | -0.26% | -0.28% | -0.12% | |
| GBP | 0.08% | 0.05% | 0.12% | 0.08% | -0.20% | -0.22% | -0.03% | |
| JPY | -0.04% | -0.02% | -0.12% | 0.00% | -0.37% | -0.38% | 0.08% | |
| CAD | 0.00% | -0.02% | -0.08% | -0.01% | -0.29% | -0.33% | -0.11% | |
| AUD | 0.25% | 0.26% | 0.20% | 0.37% | 0.29% | -0.02% | 0.17% | |
| NZD | 0.30% | 0.28% | 0.22% | 0.38% | 0.33% | 0.02% | 0.34% | |
| CHF | 0.15% | 0.12% | 0.03% | -0.08% | 0.11% | -0.17% | -0.34% |
The heat map shows percentage changes of major currencies against each other. The base currency is picked from the left column, while the quote currency is picked from the top row. For example, if you pick the Canadian Dollar from the left column and move along the horizontal line to the US Dollar, the percentage change displayed in the box will represent CAD (base)/USD (quote).
BoC dovish expectations have escalated due to deteriorating Canadian labor market conditions. Analysts at Bank of America (BofA) have projected a 25 basis points (bps) interest rate reduction by the BoC in the policy meeting this move, a move that will push borrowing rates lower to 2.5%. BofA also projected that the BoC will bring interest rates lower to 2% by the end of 2026. Commerical-to-investment bank has highlighted soaring jobless rate and inflation within the BoC’s 2% target are key factors behind the need for loosening the monetary policy further.
Meanwhile, the US Dollar (USD) holds onto Tuesday’s recovery mover ahead of the United States (US) Producer Price Index (PPI) data for August, which will be published at 12:30 GMT. The US headline PPI is expected to have grown steadily at an annualized pace of 3.3%. Meanwhile, the core PPI – which excludes volatile food and energy items – is estimated to have risen moderately by 3.5%, against 3.7% in July.
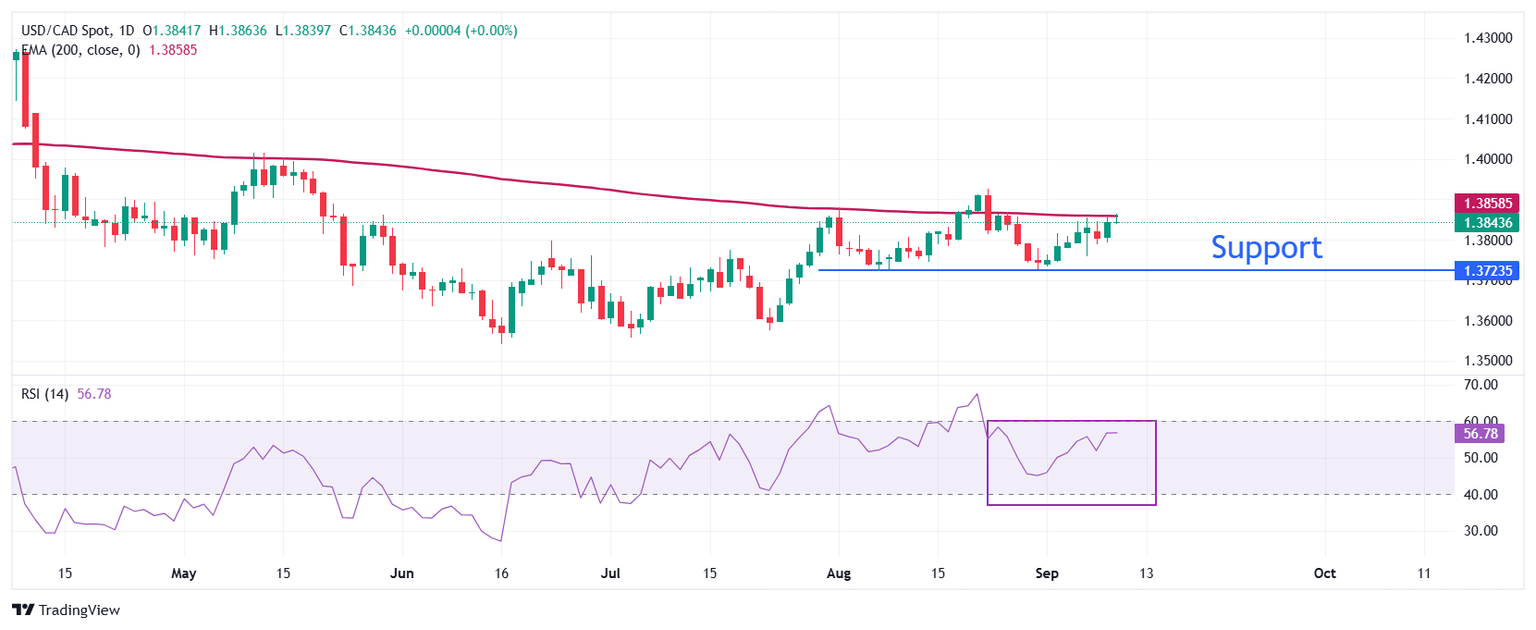
USD/CAD stays below the 200-day Exponential Moving Average (EMA), which trades around 1.3870, suggesting that the overall trend is bearish.
The 14-day Relative Strength Index (RSI) oscillates inside the 40.00-60.00 range, indicating a sideways trend.
Going forward, the asset could slide towards the round level of 1.3600 and June 16 low of 1.3540 if it breaks below the August 7 low of 1.3722.
On the flip side, a recovery move by the pair above the August 22 high of 1.3925 would open the door towards the May 15 high of 1.4000, followed by the April 9 low of 1.4075.
USD/CAD daily chart
US Dollar FAQs
The US Dollar (USD) is the official currency of the United States of America, and the ‘de facto’ currency of a significant number of other countries where it is found in circulation alongside local notes. It is the most heavily traded currency in the world, accounting for over 88% of all global foreign exchange turnover, or an average of $6.6 trillion in transactions per day, according to data from 2022. Following the second world war, the USD took over from the British Pound as the world’s reserve currency. For most of its history, the US Dollar was backed by Gold, until the Bretton Woods Agreement in 1971 when the Gold Standard went away.
The most important single factor impacting on the value of the US Dollar is monetary policy, which is shaped by the Federal Reserve (Fed). The Fed has two mandates: to achieve price stability (control inflation) and foster full employment. Its primary tool to achieve these two goals is by adjusting interest rates. When prices are rising too quickly and inflation is above the Fed’s 2% target, the Fed will raise rates, which helps the USD value. When inflation falls below 2% or the Unemployment Rate is too high, the Fed may lower interest rates, which weighs on the Greenback.
In extreme situations, the Federal Reserve can also print more Dollars and enact quantitative easing (QE). QE is the process by which the Fed substantially increases the flow of credit in a stuck financial system. It is a non-standard policy measure used when credit has dried up because banks will not lend to each other (out of the fear of counterparty default). It is a last resort when simply lowering interest rates is unlikely to achieve the necessary result. It was the Fed’s weapon of choice to combat the credit crunch that occurred during the Great Financial Crisis in 2008. It involves the Fed printing more Dollars and using them to buy US government bonds predominantly from financial institutions. QE usually leads to a weaker US Dollar.
Quantitative tightening (QT) is the reverse process whereby the Federal Reserve stops buying bonds from financial institutions and does not reinvest the principal from the bonds it holds maturing in new purchases. It is usually positive for the US Dollar.
Author

Sagar Dua
FXStreet
Sagar Dua is associated with the financial markets from his college days. Along with pursuing post-graduation in Commerce in 2014, he started his markets training with chart analysis.


