|

USD/CAD Price Analysis: The bearish playbook is unfolding, daily M-formation in focus

  • USD/CAD is carving out a bearish structure on the daily chart. 
  • Some consolidation would be expected prior to the next downside move with 1.2600 eyed.

As per the start of the week's analysis, The Chart of the Week: USD/CAD has complied with the medium-term bearish bias, the price is adhering to the market's structure and the following illustrates the bearish perspective:

USD/CAD daily chart, prior analysis

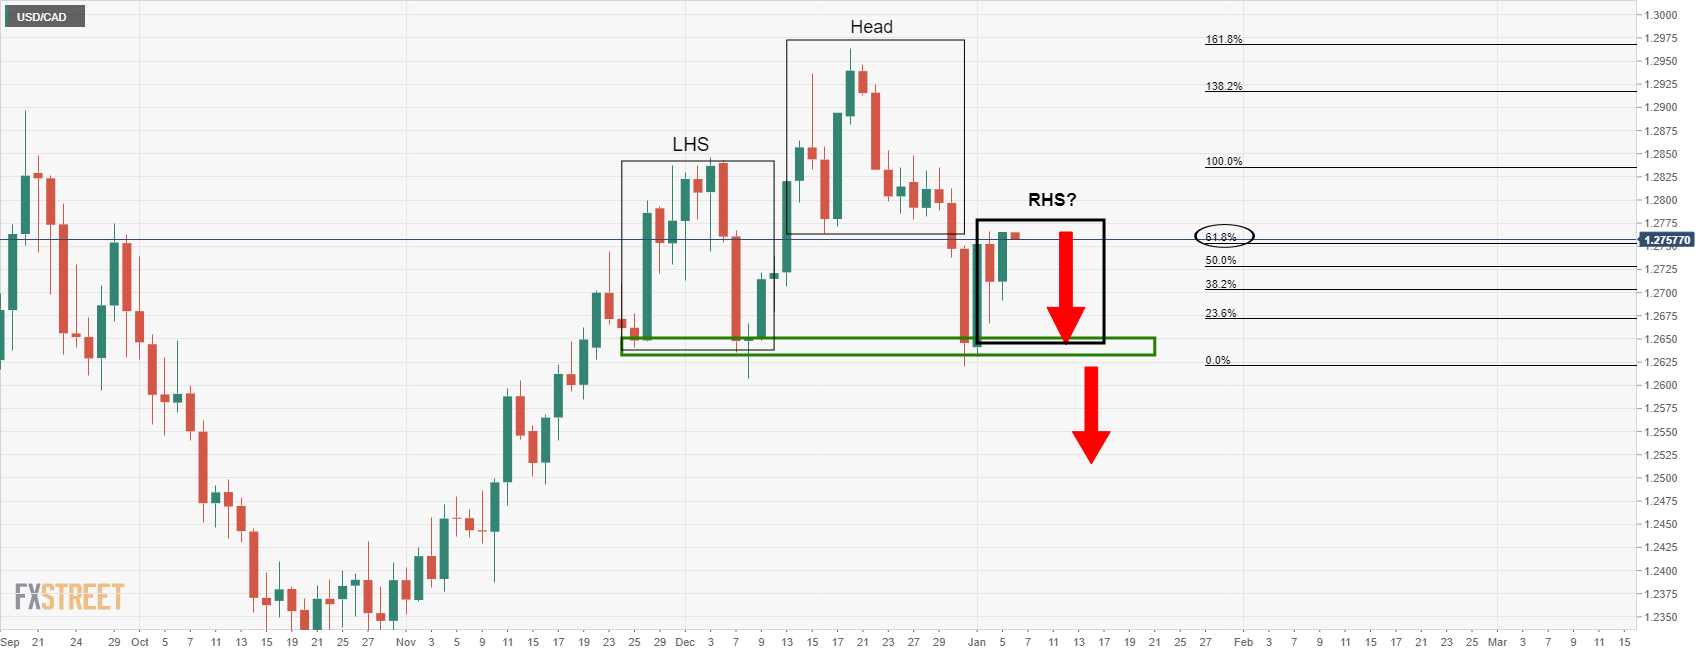
As illustrated above, the head and shoulders were in the making...

USD/CAD daily chart analysis

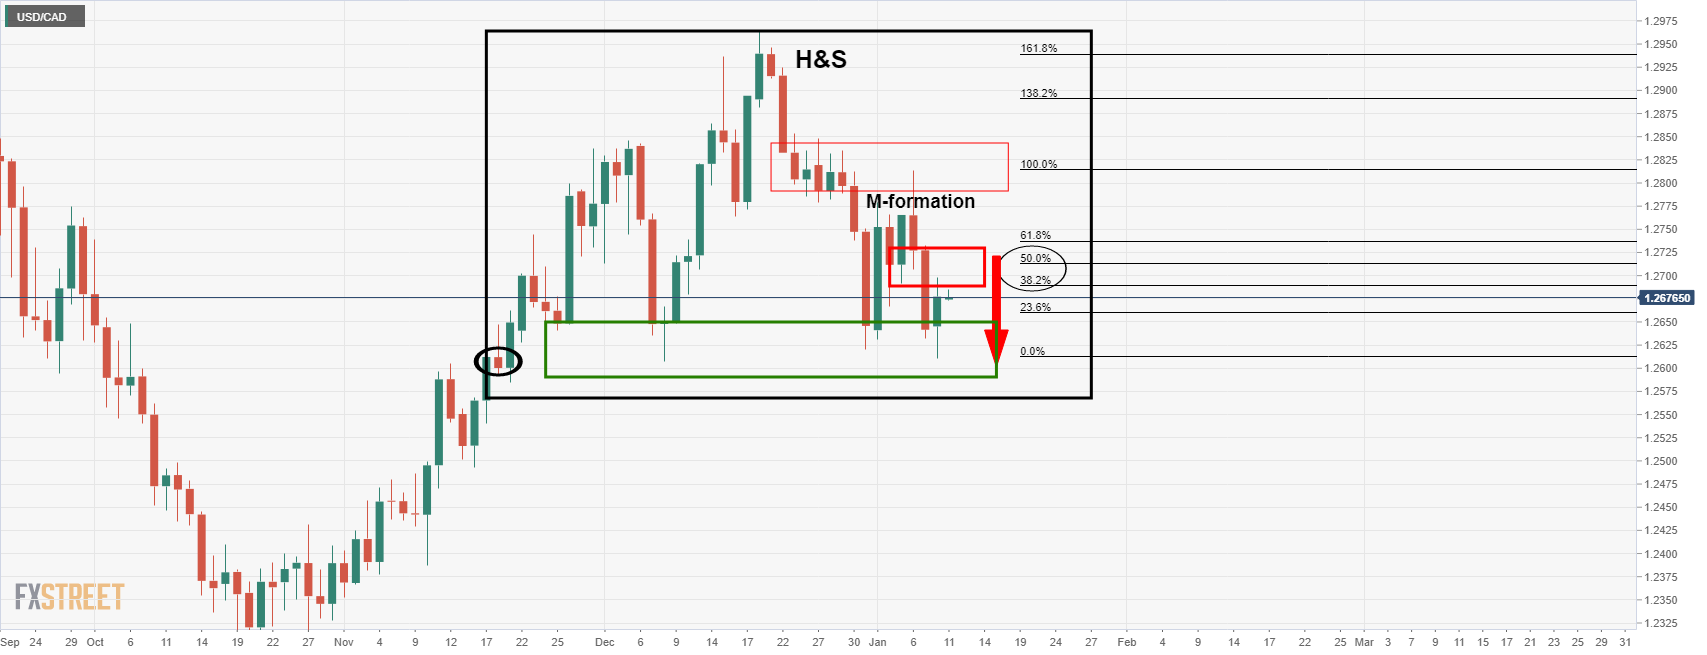
The price is now leaving an M-formation on the chart as illustrated above and is drawing the bulls into the neckline. 

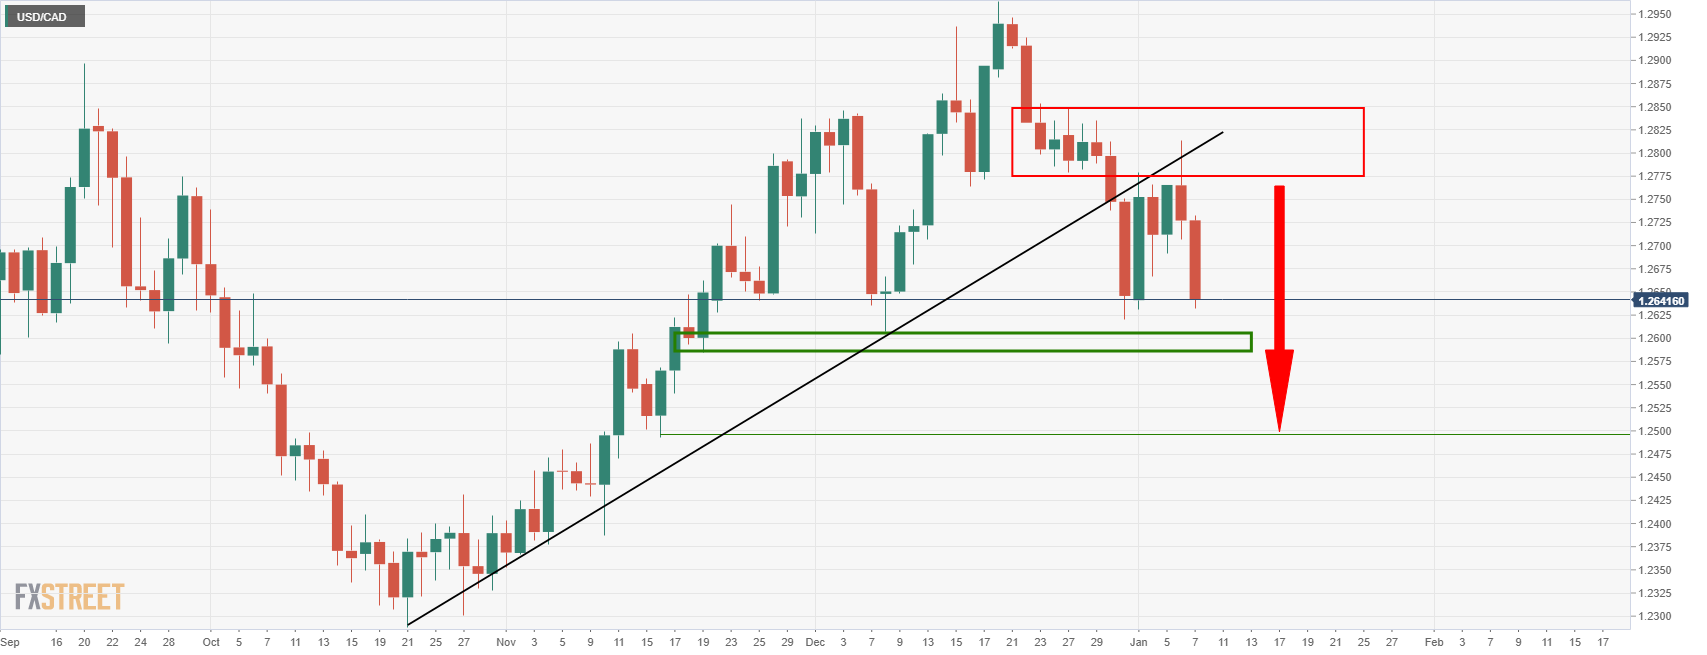
This can be seen on the 4-hour time frame as in the following prior analysis:

As seen, the prior analysis at the start of the week forecasted a move into the 1.27 area and it has played out as follows:

USD/CAD H4 chart

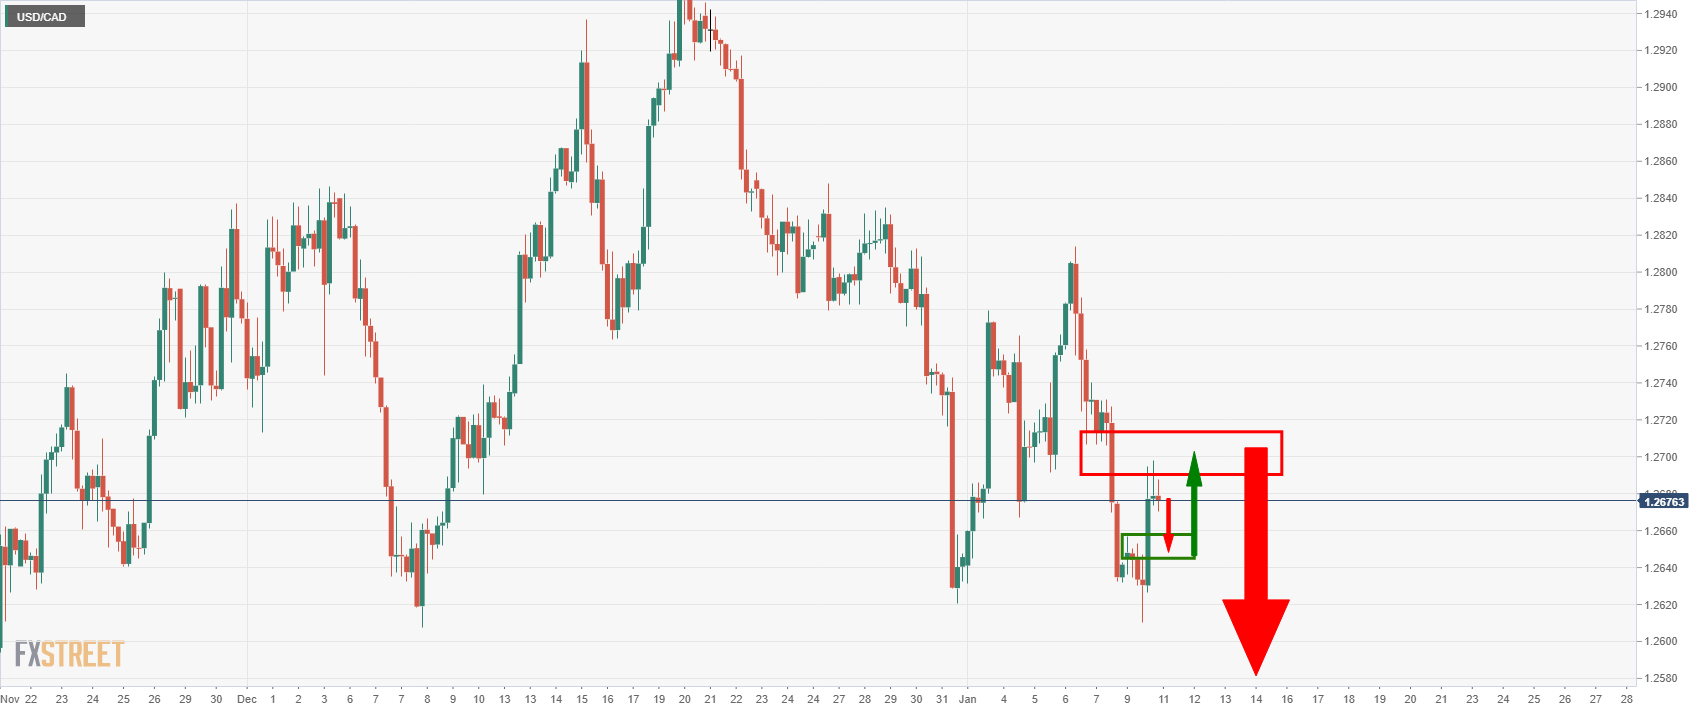
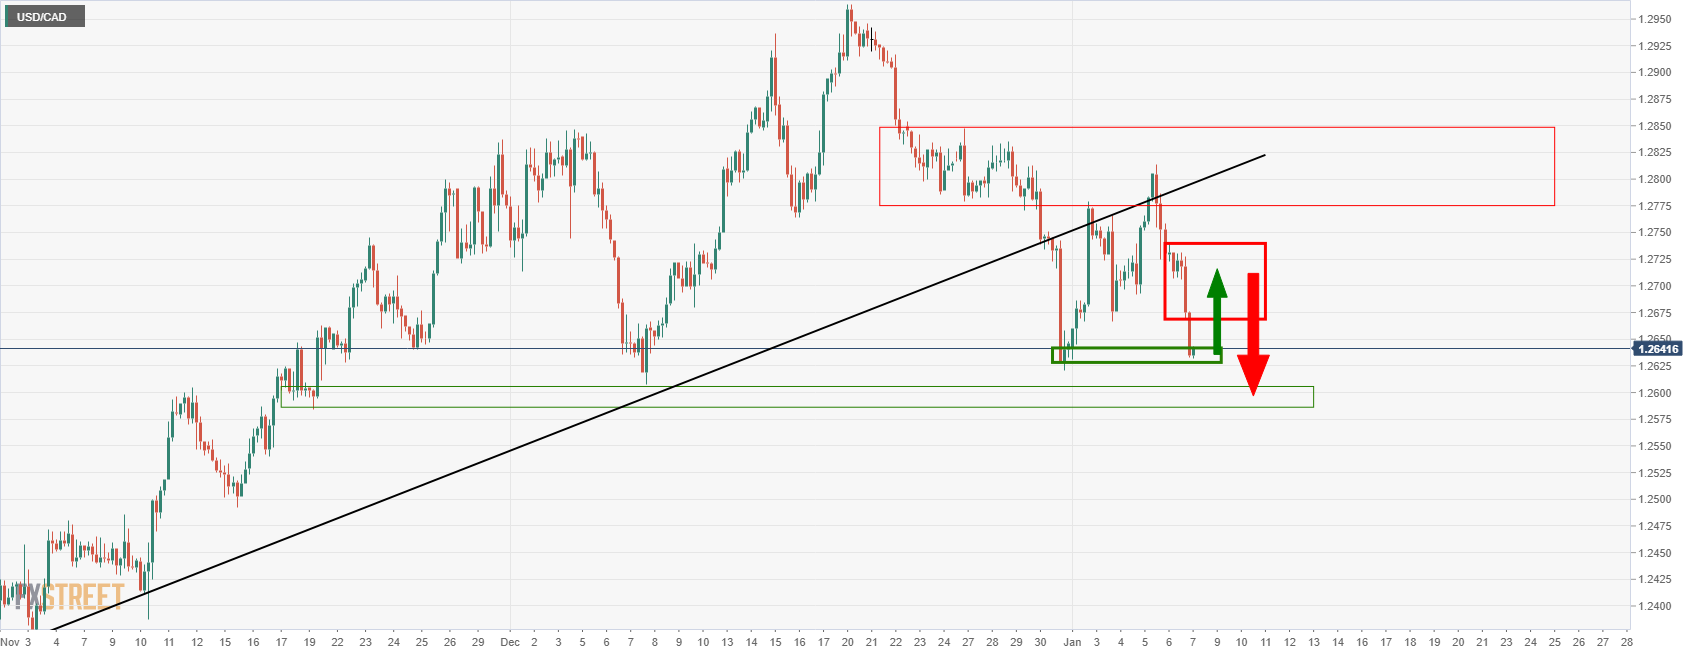
We can now expect the price to mitigate the imbalance to a restest of what would be expected to act as support on first attempts near 1.2650. This could lead to a deeper bullish correction into the daily M-formation's neckline near 1.2700/10 again prior to a full-on downside break to test 1.26 the figure. 

Author

Ross J Burland

Ross J Burland, born in England, UK, is a sportsman at heart. He played Rugby and Judo for his county, Kent and the South East of England Rugby team.

More from Ross J Burland
Share:

Markets move fast. We move first.

Orange Juice Newsletter brings you expert driven insights - not headlines. Every day on your inbox.

By subscribing you agree to our Terms and conditions.

Editor's Picks

EUR/USD eyes 1.1800 barrier near two-month highs

EUR/USD extends its gains for the second consecutive day on Tuesday and approaches 1.1800. On the daily chart, technical analysis indicates a persistent bullish bias, as the pair moves upward within the ascending channel pattern. Additionally, the 14-day Relative Strength Index at 68.89 reaffirms the bullish bias.

GBP/USD climbs to 1.3500 area, renews ten-week high

GBP/USD extends its weekly rally and trades at its highest level since early October near 1.3500. The US Dollar remains under persistent bearish pressure heading into the holidays, while Pound traders largely brush off the latest interest rate cut from the Bank of England.

Gold approaches $4,500 as record-setting rally continues

Gold builds on Monday's impressive gains and advances toward $4,500, setting fresh record-highs along the way. Heightened geopolitical tensions, combined with the broad-based US Dollar (USD) weakness ahead of the Q3 GDP data, help XAU/USD preserve its bullish momentum.

US GDP expected to highlight steady growth in Q3

The United States Bureau of Economic Analysis (BEA) will publish the first preliminary estimate of the third-quarter Gross Domestic Product on Tuesday, at 13:30 GMT. Analysts expect the data to show annualized growth of 3.2%, following the 3.8% expansion in the previous quarter.

Ten questions that matter going into 2026

2026 may be less about a neat “base case” and more about a regime shift—the market can reprice what matters most (growth, inflation, fiscal, geopolitics, concentration). The biggest trap is false comfort: the same trades can look defensive… right up until they become crowded.

XRP steadies above $1.90 support as fund inflows and retail demand rise

Ripple (XRP) is stable above support at $1.90 at the time of writing on Monday, after several attempts to break above the $2.00 hurdle failed to materialize last week. Meanwhile, institutional interest in the cross-border remittance token has remained steady.