|

USD/CAD Price Analysis: Tests 50-HMA after rising wedge breakdown

  • USD/CAD bulls trying to defend the 50-HMA support.
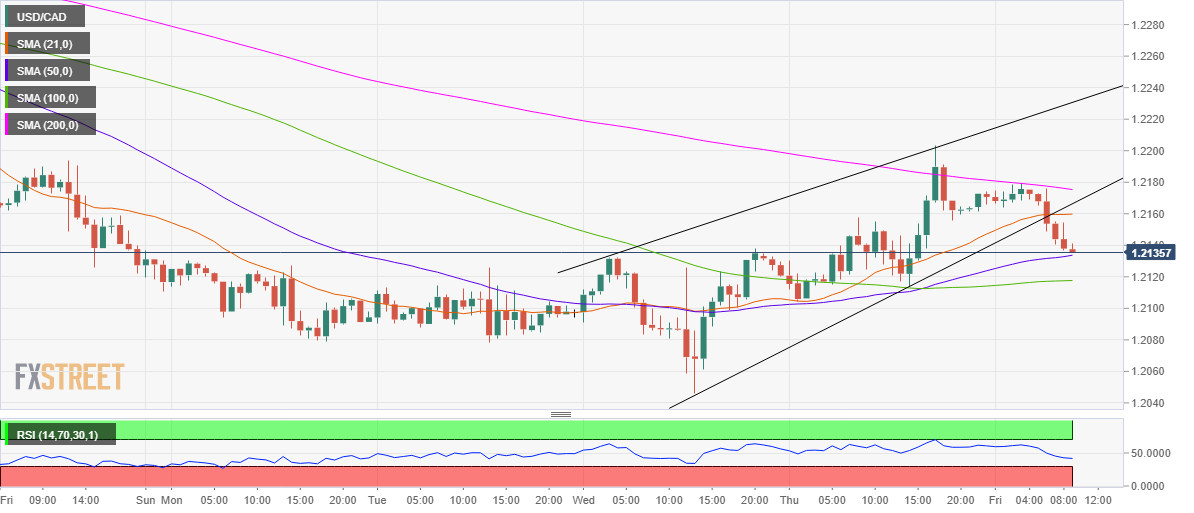
  • The spot has charted a rising wedge break down on the hourly sticks.
  • Rejection at 200-DMA prompted the U-turn in the prices.

USD/CAD is on a freefall over the last hours after the bulls failed to take out powerful resistance at the 200-hourly moving average (HMA), now at 1.2175.

With the corrective decline, the spot has charted a rising wedge break down the hourly sticks after it breached the crucial support at 1.2158. That zone is the confluence of the rising trendline and 21-HMA.

The mildly bullish 50-HMA at 1.2133 is currently testing the bearish commitments. A breach of the last could expose the 100-HMA at 1.2118.

The Relative Strength Index (RSI) edges lower within the bearish region, suggesting that there is more room to the downside.

However, the bears could bid time before the next push lower, awaiting the dollar’s reaction to the US Retail Sales release.

USD/CAD: Hourly chart

Any pullback will have to crack the 1.2160 resistance zone, the previous support now an upside barrier.

A sustained move above the latter could see the buyers once again yearning for the 200-HMA.

At the time of writing, the major is shedding 0.20% to trade around 1.2135, having felt the pull of gravity due to fresh declines in the US dollar.

Additionally, the 1% bounce in WTI prices boosts the Canadian dollar, exerting downside pressure on the spot.

The US oil rebounded this Friday after dropping 3% a day before, in response to rising covid cases in India and the news about the Colonial pipeline restart.

USD/CAD: Additional levels

USD/CAD

Overview
Today last price1.2136
Today Daily Change-0.0025
Today Daily Change %-0.21
Today daily open1.2163
 
Trends
Daily SMA201.2323
Daily SMA501.2462
Daily SMA1001.2588
Daily SMA2001.285
 
Levels
Previous Daily High1.2203
Previous Daily Low1.2104
Previous Weekly High1.2352
Previous Weekly Low1.2122
Previous Monthly High1.2654
Previous Monthly Low1.2266
Daily Fibonacci 38.2%1.2165
Daily Fibonacci 61.8%1.2142
Daily Pivot Point S11.211
Daily Pivot Point S21.2058
Daily Pivot Point S31.2011
Daily Pivot Point R11.2209
Daily Pivot Point R21.2256
Daily Pivot Point R31.2308

Author

Dhwani Mehta

Dhwani Mehta

FXStreet

Residing in Mumbai (India), Dhwani is a Senior Analyst and Manager of the Asian session at FXStreet. She has over 10 years of experience in analyzing and covering the global financial markets, with specialization in Forex and commodities markets.

More from Dhwani Mehta
Share:

Markets move fast. We move first.

Orange Juice Newsletter brings you expert driven insights - not headlines. Every day on your inbox.

By subscribing you agree to our Terms and conditions.

Editor's Picks

EUR/USD rebounds after falling toward 1.1700

EUR/USD gains traction and trades above 1.1730 in the American session, looking to end the week virtually unchanged. The bullish opening in Wall Street makes it difficult for the US Dollar to preserve its recovery momentum and helps the pair rebound heading into the weekend.

GBP/USD steadies below 1.3400 as traders assess BoE policy outlook

Following Thursday's volatile session, GBP/USD moves sideways below 1.3400 on Friday. Investors reassess the Bank of England's policy oıtlook after the MPC decided to cut the interest rate by 25 bps by a slim margin. Meanwhile, the improving risk mood helps the pair hold its ground.

Gold stays below $4,350, looks to post small weekly gains

Gold struggles to gather recovery momentum and stays below $4,350 in the second half of the day on Friday, as the benchmark 10-year US Treasury bond yield edges higher. Nevertheless, the precious metal remains on track to end the week with modest gains as markets gear up for the holiday season.

Crypto Today: Bitcoin, Ethereum, XRP rebound amid bearish market conditions

Bitcoin (BTC) is edging higher, trading above $88,000 at the time of writing on Monday. Altcoins, including Ethereum (ETH) and Ripple (XRP), are following in BTC’s footsteps, experiencing relief rebounds following a volatile week.

How much can one month of soft inflation change the Fed’s mind?

One month of softer inflation data is rarely enough to shift Federal Reserve policy on its own, but in a market highly sensitive to every data point, even a single reading can reshape expectations. November’s inflation report offered a welcome sign of cooling price pressures. 

XRP rebounds amid ETF inflows and declining retail demand demand

XRP rebounds as bulls target a short-term breakout above $2.00 on Friday. XRP ETFs record the highest inflow since December 8, signaling growing institutional appetite.