|

USD/CAD Price Analysis: Struggles near multi-day low, seems vulnerable to slide further

  • USD/CAD meets with a fresh supply on Tuesday and is weighed down by a combination of factors.
  • An uptick in Oil prices underpins the Loonie and exerts some pressure amid sustained USD selling.
  • The recent failure near the 50-day SMA and the subsequent fall support prospects for further losses.

The USD/CAD pair comes under some renewed selling pressure following the previous day's modest bounce and hits a four-day low, around the 1.3250 area during the Asian session on Tuesday.

Crude Oil prices regain some positive traction and reverse a part of Monday's pullback from a five-week high, which, in turn, is seen underpinning the commodity-linked Loonie. The US Dollar (USD), on the other hand, prolongs its descending trend for the fourth straight day and drops to a two-month low. This contributes to the offered tone surrounding the USD/CAD pair and supports prospects for further losses.

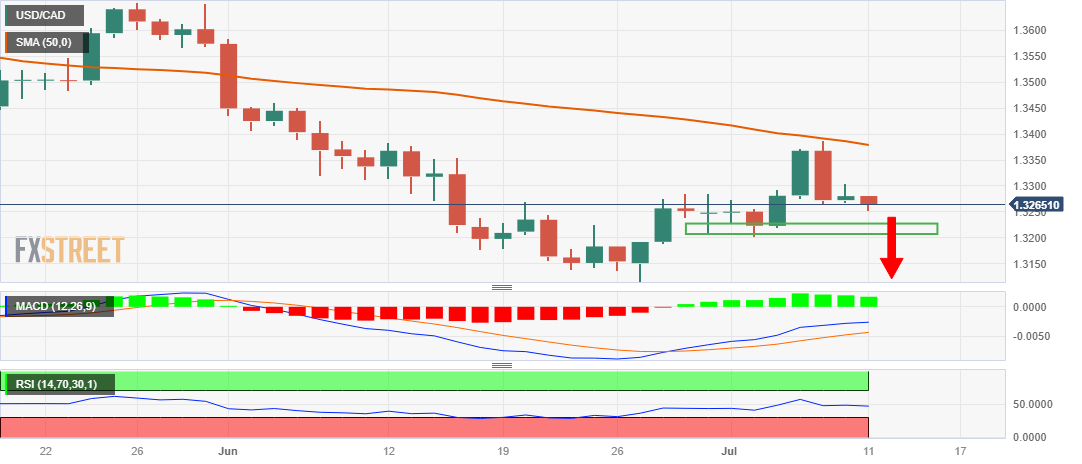
From a technical perspective, last week's failure near the 50-day Simple Moving Average (SMA) and the subsequent sharp pullback from the 1.3385 region, or a one-month peak, favour bearish traders. Moreover, oscillators on the daily chart have again started gaining negative traction and add credence to the negative outlook, suggesting that the path of least resistance for the USD/CAD pair is to the downside.

Hence, some follow-through decline towards testing the next relevant support near the 1.3225-1.3220 area, en route to the 1.3200 mark, or the monthly low touched last week, looks like a distinct possibility. A convincing break below the latter could make the USD/CAD pair vulnerable to weaken further below the 1.3145 intermediate support and challenge the YTD low, around the 1.3115 area touched in June.

On the flip side, the overnight swing high, around 1.3300 round figure now seems to act as an immediate hurdle. A sustained move beyond might trigger a short-covering move and lift the USD/CAD pair back towards the 50-day SMA resistance, currently around the 1.3375-1.3380 region. This is closely followed by the 1.3400 mark, which if cleared decisively will shift the near-term bias in favour of bullish traders.

USD/CAD daily chart

fxsoriginal

Key levels to watch

USD/CAD

Overview
Today last price1.3264
Today Daily Change-0.0016
Today Daily Change %-0.12
Today daily open1.328
 
Trends
Daily SMA201.3239
Daily SMA501.3386
Daily SMA1001.3487
Daily SMA2001.3501
 
Levels
Previous Daily High1.3304
Previous Daily Low1.3268
Previous Weekly High1.3387
Previous Weekly Low1.3203
Previous Monthly High1.3585
Previous Monthly Low1.3117
Daily Fibonacci 38.2%1.3291
Daily Fibonacci 61.8%1.3282
Daily Pivot Point S11.3265
Daily Pivot Point S21.3249
Daily Pivot Point S31.3229
Daily Pivot Point R11.33
Daily Pivot Point R21.332
Daily Pivot Point R31.3336

Author

Haresh Menghani

Haresh Menghani is a detail-oriented professional with 10+ years of extensive experience in analysing the global financial markets.

More from Haresh Menghani
Share:

Markets move fast. We move first.

Orange Juice Newsletter brings you expert driven insights - not headlines. Every day on your inbox.

By subscribing you agree to our Terms and conditions.

Editor's Picks

EUR/USD rebounds after falling toward 1.1700

EUR/USD gains traction and trades above 1.1730 in the American session, looking to end the week virtually unchanged. The bullish opening in Wall Street makes it difficult for the US Dollar to preserve its recovery momentum and helps the pair rebound heading into the weekend.

GBP/USD steadies below 1.3400 as traders assess BoE policy outlook

Following Thursday's volatile session, GBP/USD moves sideways below 1.3400 on Friday. Investors reassess the Bank of England's policy oıtlook after the MPC decided to cut the interest rate by 25 bps by a slim margin. Meanwhile, the improving risk mood helps the pair hold its ground.

Gold stays below $4,350, looks to post small weekly gains

Gold struggles to gather recovery momentum and stays below $4,350 in the second half of the day on Friday, as the benchmark 10-year US Treasury bond yield edges higher. Nevertheless, the precious metal remains on track to end the week with modest gains as markets gear up for the holiday season.

Crypto Today: Bitcoin, Ethereum, XRP rebound amid bearish market conditions

Bitcoin (BTC) is edging higher, trading above $88,000 at the time of writing on Monday. Altcoins, including Ethereum (ETH) and Ripple (XRP), are following in BTC’s footsteps, experiencing relief rebounds following a volatile week.

How much can one month of soft inflation change the Fed’s mind?

One month of softer inflation data is rarely enough to shift Federal Reserve policy on its own, but in a market highly sensitive to every data point, even a single reading can reshape expectations. November’s inflation report offered a welcome sign of cooling price pressures. 

XRP rebounds amid ETF inflows and declining retail demand demand

XRP rebounds as bulls target a short-term breakout above $2.00 on Friday. XRP ETFs record the highest inflow since December 8, signaling growing institutional appetite.