|

USD/CAD Price Analysis: Shifts auction below 1.3500 as oil rebounds and USD Index retreats

  • USD/CAD has slipped sharply below 1.3500 amid a sharp recovery in the oil price upside exhaustion in the USD Index.
  • Monthly Canadian Retail Sales data is seen contracting by 1.4% vs. a contraction of 0.2% recorded earlier.
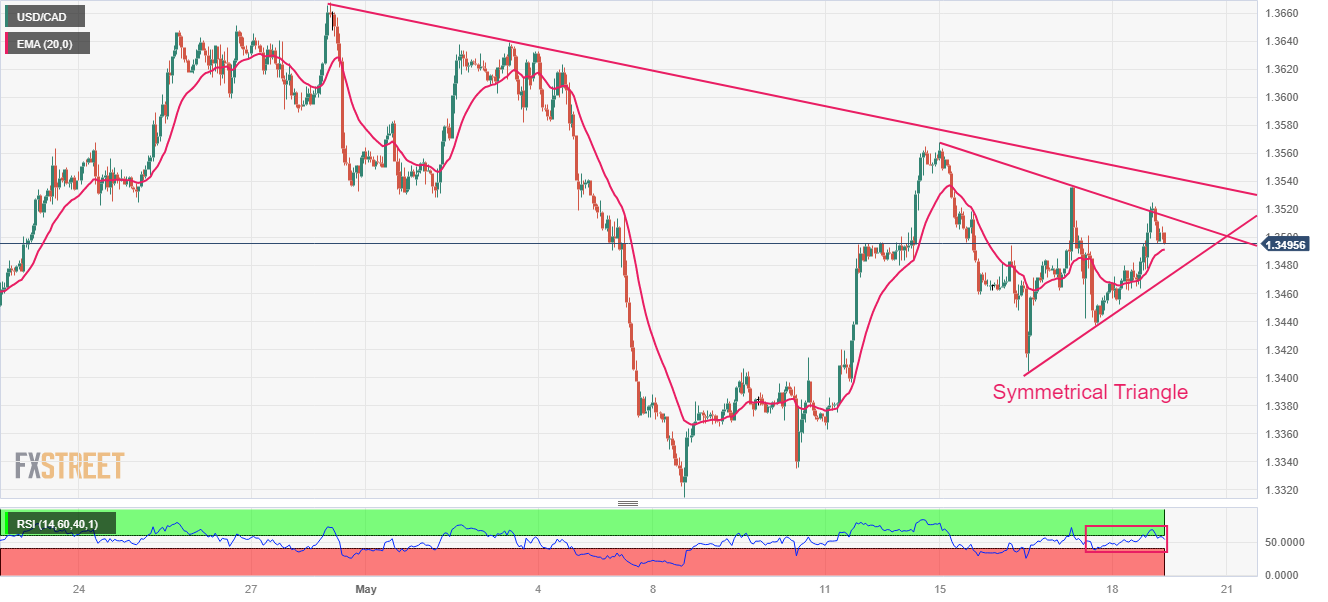
  • USD/CAD is auctioning in a Symmetrical Triangle chart pattern, which indicates a volatility contraction.

The USD/CAD pair has dropped below the psychological support of 1.3500 in the early Tokyo session. The Loonie asset has sensed selling pressure as the oil price has rebounded sharply above $72.00 amid optimism over the US borrowing cap raise and the US Dollar Index (DXY) has retreated after a less-confident pullback.

Investors should note that Canada is the leading exporter of oil to the United States and a recovery in the oil price supports the Canadian Dollar.

Going forward, investors will keep an eye on monthly Canadian Retail Sales data (March). Monthly Retail Sales data is seen contracting by 1.4% vs. a contraction of 0.2% recorded earlier. A decline in househoulds’ demand would allow the Bank of Canada (BoC) to keep its interest rate policy steady further.

USD/CAD is auctioning in a Symmetrical Triangle chart pattern on an hourly scale, which indicates a volatility contraction. The Loonie asset sensed selling pressure while attempting a breakout of the neutral triangle. The downward-sloping trendline from April 28 high at 1.3668 is acting as a major barricade for the US Dollar bulls.

The 20-period Exponential Moving Average (EMA) at 1.3492 is close to the asset price, indicating a lackluster performance.

Also, the Relative Strength Index (RSI) (14) has slipped back into the 40.00-60.00 range, which signals that investors await a potential trigger for a decisive move.

The upside bias will get strengthened if the Loonie asset manages to surpass the round-level resistance of 1.3600. This will expose the asset to May 21 low at 1.3644 followed by the round-level resistance at 1.3700.

On the flip side, a break below May 18 low at 1.3452 will fade the upside bias and will drag the asset toward April 04 low at 1.3406 and May 08 low at 1.3315.

USD/CAD hourly chart
USD/CAD

Overview
Today last price1.3495
Today Daily Change0.0040
Today Daily Change %0.30
Today daily open1.3455
 
Trends
Daily SMA201.3512
Daily SMA501.3554
Daily SMA1001.3511
Daily SMA2001.347
 
Levels
Previous Daily High1.3536
Previous Daily Low1.3437
Previous Weekly High1.3565
Previous Weekly Low1.3315
Previous Monthly High1.3668
Previous Monthly Low1.3301
Daily Fibonacci 38.2%1.3475
Daily Fibonacci 61.8%1.3498
Daily Pivot Point S11.3416
Daily Pivot Point S21.3377
Daily Pivot Point S31.3317
Daily Pivot Point R11.3515
Daily Pivot Point R21.3575
Daily Pivot Point R31.3614

Author

Sagar Dua

Sagar Dua

FXStreet

Sagar Dua is associated with the financial markets from his college days. Along with pursuing post-graduation in Commerce in 2014, he started his markets training with chart analysis.


More from Sagar Dua
Share:

Editor's Picks

GBP/USD keeps the bid bias near 1.3550

GBP/USD leaves behind part of the recent three-day retracement and hovers around the 1.3550 region on Monday. The Greenback’s fresh downward trend helps Cable and the rest of the risk complex recoup part of the recent ground lost while attention remains on the potential Fed rate path.

EUR/USD retakes 1.1600; looks at the 200-day SMA

EUR/USD manages to gather fresh steam and advances past the 1.1600 hurdle as Monday’s NA session draws to a close. Indeed, the pair patially reverses Friday’s sharp retracement amid the renewed downside momentum in the US Dollar. Moving forward, the flash Inflation Rate in the euro zone and US JOLTs and the ISM Manufacturing should keep investors entertained on turnaround Tuesday.

Gold bulls seem hesitant above $4,450 on USD demand

Gold is struggling to build on the overnight bounce from sub-$4,400 levels in Asia on Tuesday amid a stronger US Dollar. Fed Chair Kevin Warsh's hawkish message, along with inflation risks stemming from higher oil prices, lift September rate-hike bets. Adding to this, escalating US-Iran tensions could support the safe-haven USD, warranting caution for XAU/USD bulls.

Bitcoin shows resilience at $78,000 – Arbitrum, Curve DAO rally
The broader cryptocurrency market sustains its risk-on sentiment, with Bitcoin (BTC) showing resilience near $78,000 on Tuesday. Arbitrum (ARB) records double-digit gains over the last 24 hours as the Robinhood app, built on Arbitrum Orbit, hits a record high in revenue collection, while Curve DAO (CRV) follows suit. Bitcoin trades at $78,415 at press time on Tuesday, holding a clear bullish bias.
Fed Chair Warsh runs open-mouth operations at Jackson Hole but can he deliver?
Federal Reserve Chairman Kevin Warsh moved markets on Friday with his Jackson Hole speech, even though the central bank has yet to do anything to move inflation. Clearly, Warsh wants to convey a message. He’s tough on inflation, and the Fed will “deliver price stability.”
Diesel’s record $100 warning: The oil shock hiding in plain sight

The Oil market may look calmer than it did a few months ago, but diesel is sending a very different message. The US diesel crack spread, the premium of ultra-low sulphur diesel futures over WTI, recently surged above $100 per barrel for the first time, reaching an intraday record of just over $102.00.