USD/CAD Price Analysis: Set for further downside below 1.3000


  • USD/CAD keeps week-start break of weekly support, off intraday low.
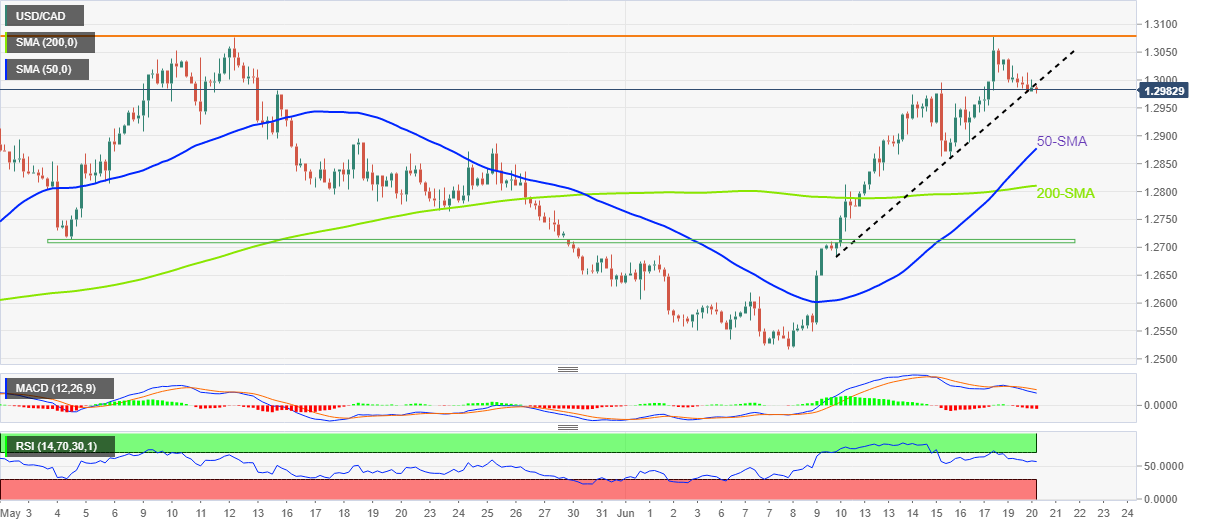
  • Double tops around 1.3080 and downbeat oscillators keep sellers hopeful.
  • Key SMAs can probe the downside ahead of six-week-old horizontal support.
  • The late 2020 peak can lure the bulls on crossing 1.3080.

USD/CAD bounces off intraday low of 1.2975, at 1.2983 by the press time, as it extends the previous day’s losses during Tuesday’s Asian session.

In doing so, the loonie pair holds onto the downside break of a one-week-old ascending trend line, previous support, while keeping the Friday’s U-turn from a 19-month high.

It’s worth noting that the Loonie pair ticked up to refresh the multi-month high before reversing from 1.3075. In that process, the quote portrayed a double-top bearish chart pattern surrounding the 1.3080-75 area.

Hence, the double-top formation and a downbeat break of the immediate support, not to forget bearish MACD signals and descending RSI line, suggest the USD/CAD pair’s further downside.

As a result, the 50-SMA and the 200-SMA levels, respectively around 1.2880 and 1.2810, are likely luring the short-term bears before directing them to the horizontal area comprising multiple levels marked since early May around 1.2710.

On the contrary, recovery moves need to jump back beyond the support-turned-resistance line, close to 1.2990 by the press time, to recall the buyers. Also acting as an immediate upside filter is the 1.3000 psychological magnet.

Should the USD/CAD pair remains firmer past 1.3000, it can again aim to cross the 1.3080 hurdle, which in turn holds the key for a rally toward the latest 2020 levels surrounding 1.3175-80.

USD/CAD: Four-hour chart

Trend: Further downside expected

Additional important levels

Overview
Today last price 1.2981
Today Daily Change -0.0057
Today Daily Change % -0.44%
Today daily open 1.3038
 
Trends
Daily SMA20 1.2745
Daily SMA50 1.2768
Daily SMA100 1.2717
Daily SMA200 1.2671
 
Levels
Previous Daily High 1.3079
Previous Daily Low 1.2939
Previous Weekly High 1.3079
Previous Weekly Low 1.2774
Previous Monthly High 1.3077
Previous Monthly Low 1.2629
Daily Fibonacci 38.2% 1.3026
Daily Fibonacci 61.8% 1.2993
Daily Pivot Point S1 1.2958
Daily Pivot Point S2 1.2879
Daily Pivot Point S3 1.2819
Daily Pivot Point R1 1.3098
Daily Pivot Point R2 1.3158
Daily Pivot Point R3 1.3237


Share: Feed news

Information on these pages contains forward-looking statements that involve risks and uncertainties. Markets and instruments profiled on this page are for informational purposes only and should not in any way come across as a recommendation to buy or sell in these assets. You should do your own thorough research before making any investment decisions. FXStreet does not in any way guarantee that this information is free from mistakes, errors, or material misstatements. It also does not guarantee that this information is of a timely nature. Investing in Open Markets involves a great deal of risk, including the loss of all or a portion of your investment, as well as emotional distress. All risks, losses and costs associated with investing, including total loss of principal, are your responsibility. The views and opinions expressed in this article are those of the authors and do not necessarily reflect the official policy or position of FXStreet nor its advertisers. The author will not be held responsible for information that is found at the end of links posted on this page.

If not otherwise explicitly mentioned in the body of the article, at the time of writing, the author has no position in any stock mentioned in this article and no business relationship with any company mentioned. The author has not received compensation for writing this article, other than from FXStreet.

FXStreet and the author do not provide personalized recommendations. The author makes no representations as to the accuracy, completeness, or suitability of this information. FXStreet and the author will not be liable for any errors, omissions or any losses, injuries or damages arising from this information and its display or use. Errors and omissions excepted.

The author and FXStreet are not registered investment advisors and nothing in this article is intended to be investment advice.

Recommended content


Recommended content

Editors’ Picks

EUR/USD clings to daily gains above 1.0650

EUR/USD clings to daily gains above 1.0650

EUR/USD gained traction and turned positive on the day above 1.0650. The improvement seen in risk mood following the earlier flight to safety weighs on the US Dollar ahead of the weekend and helps the pair push higher.

EUR/USD News

GBP/USD recovers toward 1.2450 after UK Retail Sales data

GBP/USD recovers toward 1.2450 after UK Retail Sales data

GBP/USD reversed its direction and advanced to the 1.2450 area after touching a fresh multi-month low below 1.2400 in the Asian session. The positive shift seen in risk mood on easing fears over a deepening Iran-Israel conflict supports the pair.

GBP/USD News

Gold holds steady at around $2,380 following earlier spike

Gold holds steady at around $2,380 following earlier spike

Gold stabilized near $2,380 after spiking above $2,400 with the immediate reaction to reports of Israel striking Iran. Meanwhile, the pullback seen in the US Treasury bond yields helps XAU/USD hold its ground.

Gold News

Bitcoin Weekly Forecast: BTC post-halving rally could be partially priced in Premium

Bitcoin Weekly Forecast: BTC post-halving rally could be partially priced in

Bitcoin price shows no signs of directional bias while it holds above  $60,000. The fourth BTC halving is partially priced in, according to Deutsche Bank’s research. 

Read more

Week ahead – US GDP and BoJ decision on top of next week’s agenda

Week ahead – US GDP and BoJ decision on top of next week’s agenda

US GDP, core PCE and PMIs the next tests for the Dollar. Investors await BoJ for guidance about next rate hike. EU and UK PMIs, as well as Australian CPIs also on tap.

Read more

Forex MAJORS

Cryptocurrencies

Signatures