|

USD/CAD Price Analysis: Retreats from 1.2745 hurdle, BOC Interest Rate Decision eyed

  • USD/CAD fades the previous day’s rebound from three-week low.
  • 50-SMA, one-week-old resistance line guards immediate upside.
  • 200-SMA, 50% Fibonacci retracement limit short-term declines ahead of 1.2560-55 area.
  • Firmer RSI, likely priced-in BOC rate-hike keep buyers hopeful to visit 1.2800 resistance.

USD/CAD eases from the weekly top to 1.2730 during the initial Asian session on Wednesday. In doing so, the Loonie pair steps back from the convergence of the 50-SMA and one-week-long descending trend line ahead of the key Bank of Canada (BOC) monetary policy meeting.

Although the BOC is up for the first rate-hike since 2017, the action has mostly been priced-in, which in turn favors the odds of the pair’s run-up should the forward guidance disappoint traders.

Read: Bank of Canada Rate Decision Preview: Hawkish hike to exacerbate the pain in USD/CAD

Technically, sustained trading beyond the key SMAs join firmer RSI and receding the bearish bias of MACD to hint at the pair’s further upside.

However, a clear break above the 1.2745 immediate hurdle becomes necessary for the USD/CAD bulls to aim for January’s high near 1.2800.

Should the quote rises past 1.2800, the latest swing top surrounding 1.2880 will be in focus.

On the contrary, pullback moves may initially aim for the 200-SMA level surrounding 1.2680 ahead of the 50% Fibonacci retracement (Fibo.) of January-February upside, near 1.2660.

Following that, a six-week-old horizontal area near 1.2560-55 will lure the USD/CAD bears.

USD/CAD: Four-hour chart

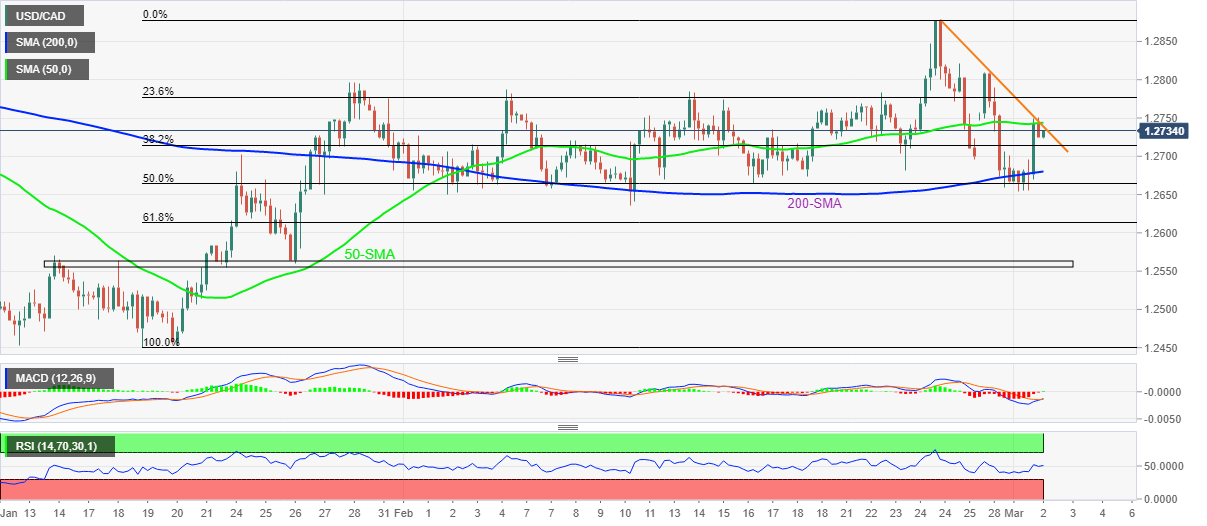
Trend: Further upside expected

Additional important levels

Overview
Today last price1.2724
Today Daily Change-0.0018
Today Daily Change %-0.14%
Today daily open1.2742
 
Trends
Daily SMA201.2721
Daily SMA501.2692
Daily SMA1001.264
Daily SMA2001.2565
 
Levels
Previous Daily High1.275
Previous Daily Low1.2654
Previous Weekly High1.2878
Previous Weekly Low1.2682
Previous Monthly High1.2878
Previous Monthly Low1.2636
Daily Fibonacci 38.2%1.2717
Daily Fibonacci 61.8%1.2752
Daily Pivot Point S11.2621
Daily Pivot Point S21.2565
Daily Pivot Point S31.2471
Daily Pivot Point R11.2772
Daily Pivot Point R21.2866
Daily Pivot Point R31.2922

Author

Anil Panchal

Anil Panchal

FXStreet

Anil Panchal has nearly 15 years of experience in tracking financial markets. With a keen interest in macroeconomics, Anil aptly tracks global news/updates and stays well-informed about the global financial moves and their implications.

More from Anil Panchal
Share:

Editor's Picks

AUD/USD falls to near 0.7100 after slipping below 50-day EMA

AUD/USD depreciates after registering minor gains in the previous day, trading around 0.7120 during the Asian hours. The technical analysis of the daily chart shows the pair consolidating sideways within a rectangle pattern, as neither bulls nor bears gain control. The AUD/USD pair is holding a slight bearish tone however as it sits beneath both the nine-day and 50-day EMAs.

160.00: USD/JPY back near intervention territory after upbeat US jobs report

US Nonfarm Payrolls beat expectations by a wide margin in May, with 172K jobs added. The US Dollar rebounds after the release, helping USD/JPY recover from its intraday lows. Warnings from Japanese authorities continue to limit upside potential near the 160.00 threshold.

Gold declines to new 10-week low below $4,400

Gold (XAU/USD) stays under heavy bearish pressure in the American session on Friday and remains on track to end the week deep in negative territory. After the data from the US showed Nonfarm Payrolls rose by 172K in May, the benchmark 10-year US Treasury bond yield and the US Dollar Index rose sharply, dragging XAU/USD to its weakest level snce late March below $4,400.

Cardano hits five-year low even as Hoskinson clarifies "break" isn't an exit

Cardano (ADA) price is down 10% at press time on Friday, extending losses over 30% so far this week amid Charles Hoskinson's clarification that "break" isn't an exit.

Week ahead – Fed countdown begins amid US inflation data and geopolitical risks

Fed Chair Warsh’s first meeting approaches as key US inflation data could reshape expectations. Oil prices remain elevated as US-Iran talks continue; tariffs also return to the spotlight. ECB is expected to hike; will it be a one-off move or is July live?

The US economy defies the rules: 100 days into the Oil shock and the recession signal is still missing

More than three months after the start of the Iran war and the resulting disruption to global energy markets, the US economy continues to display remarkable resilience. The conflict has triggered a sharp rise in Oil prices, reignited inflationary pressures and fueled widespread concerns about a potential economic slowdown.