|

USD/CAD Price Analysis: Remains inside the woods in a thin trading-volume session

  • USD/CAD juggles near Friday’s low around 1.3650 as trading volume is low due to holiday in US markets.
  • Traders pare bets supporting Fed rate cuts in September.
  • The BoC is widely anticipated to start reducing interest rates from June.

The USD/CAD pair trades in a narrow range near Friday’s low around 1.3650 in Monday’s European session. The Loonie asset is on the backfoot as the US Dollar faces selling pressure in a thin trading volume session as the United States (US) markets are closed on account of Memorial Day.

The US Dollar could bounce back as investors worry that the Federal Reserve (Fed) will not return to policy normalization before the last quarter of this year. The CME FedWatch tool shows that probability for interest rates remaining steady at their current levels after the September meeting has increased to 51% from 38% recorded last week.

Also, Fed policymakers continue to maintain a hawkish guidance on interest rates as they believe that one-time decline in the inflation data as recorded for April is insufficient to get confidence that the progress in the disinflation process has resumed.

Meanwhile, the Canadian Dollar could come under pressure as investors expect that the Bank of Canada (BoC) will start reducing interest rates from the June meeting. Canada’s weak Retail Sales and consistently declining price pressures have prompted expectations for BoC rate-cuts in June.

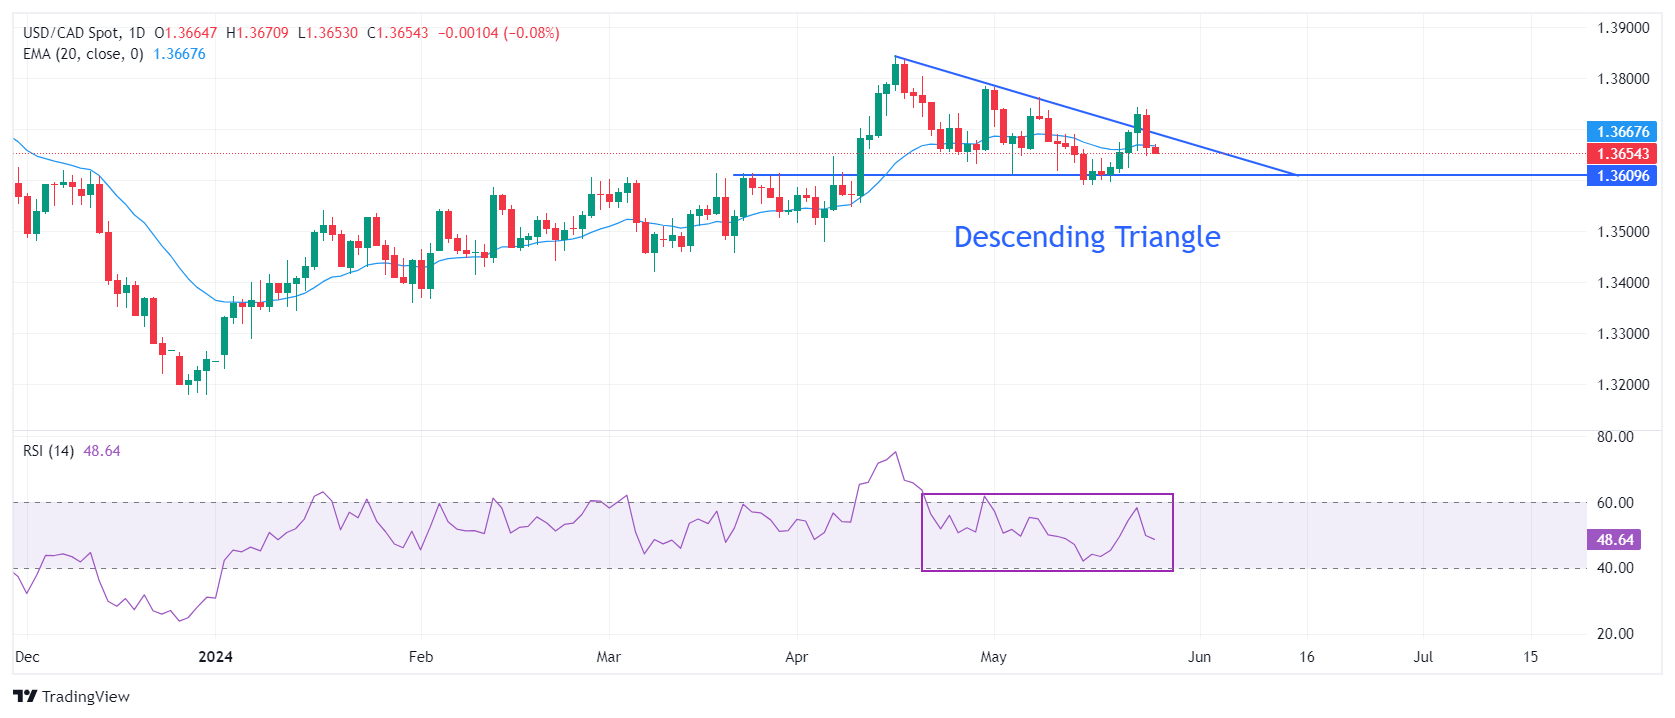
USD/CAD trades in a Descending Triangle chart formation on a daily timeframe, which exhibits a sharp volatility contraction. The downward-sloping border of the above-mentioned chart pattern is plotted from April 16 high at 1.3846 while the horizontal support is marked from March 25 high near 1.3570.

The Loonie asset remains sticky to the 20-day Exponential Moving Average (EMA) near 1.3670, suggesting a sideways trend.

The 14-period Relative Strength Index (RSI) oscillates in the 40.00-60.00 range, indicating indecisiveness among market participants.

Fresh buying opportunity would emerge if the asset breaks above April 30 high at 1.3785. This would drive the asset towards April 17 high at 1.3838, followed by the round-level resistance of 1.3900.

In an alternate scenario, a breakdown below May 3 low around 1.3600 will expose the asset to the April 9 low around 1.3547 and the psychological support of 1.3500.

USD/CAD daily chart

USD/CAD

Overview
Today last price1.3656
Today Daily Change-0.0009
Today Daily Change %-0.07
Today daily open1.3665
 
Trends
Daily SMA201.3676
Daily SMA501.3649
Daily SMA1001.3566
Daily SMA2001.3572
 
Levels
Previous Daily High1.3739
Previous Daily Low1.3648
Previous Weekly High1.3744
Previous Weekly Low1.3596
Previous Monthly High1.3846
Previous Monthly Low1.3478
Daily Fibonacci 38.2%1.3683
Daily Fibonacci 61.8%1.3704
Daily Pivot Point S11.3629
Daily Pivot Point S21.3593
Daily Pivot Point S31.3538
Daily Pivot Point R11.372
Daily Pivot Point R21.3775
Daily Pivot Point R31.3811

Author

Sagar Dua

Sagar Dua

FXStreet

Sagar Dua is associated with the financial markets from his college days. Along with pursuing post-graduation in Commerce in 2014, he started his markets training with chart analysis.

More from Sagar Dua
Share:

Editor's Picks

GBP/USD bounces off lows, back above 1.3200

After bottoming out near 1.3160, GBP/USD manages to regain a bit of shine and reclaim the 1.3200 mark and beyond at the end of the week. Stronger-than-expected UK Retail Sales data seem to be helping the British Pound limit its losses, while the chaotic UK political environment keeps the bulls at bay for now.

EUR/USD looks consolidative around 1.1460

EUR/USD stages a modest rebound after slipping to a three-month low below 1.1420 at the end of the week. That said, the pair now looks to consolidate humble gains just above 1.1460 despite growing uncertainty surrounding the next round of US-Iran negotiations, which keeps the US Dollar’s downside contained.

Gold slips back to six-day lows, targets $4,100

Gold retreats for the third consecutive day on Friday, eroding gains seen in the first half of the week and approaching the key $4,100 mark per troy ounce. Indeed, the precious metal continues to face headwinds from the Fed's hawkish stance and renewed uncertainty surrounding the next round of US-Iran negotiations.

Solana extends correction despite ETF inflows, RWA adoption

Solana (SOL) price edges below $70 extending its losses for the fourth straight day this week. The institutional demand for Solana is building, with steady inflows so far this week and Morgan Stanley’s amended S-1 filing for a Solana-focused Exchange-Traded Fund.

The Iran war didn't break the US economy, but what happens next?

Nearly four months after the start of the Iran war, the US economy remains remarkably resilient. While the conflict initially triggered a severe disruption to global energy markets and a sharp rise in Oil prices, recent diplomatic progress between Washington and Tehran has eased concerns about a prolonged supply shock.

Regime change: Inside Kevin Warsh's first move to make the Fed unreadable on purpose

The rate did not move. That was the least interesting thing about Kevin Warsh's first meeting in charge of the Fed. The FOMC held its benchmark at 3.50%-3.75% for the fourth straight meeting, exactly as priced, and then the new chair used his first press conference to dismantle the machinery the market has leaned on for a decade.