|

USD/CAD Price Analysis: Recovery move to near 1.3700 looks vulnerable as US Inflation decelerates

  • The recovery move from USD/CAD to near 1.3700 seems to lack confidence amid the risk-on mood.
  • Softening US inflation is favoring a continuation of a lower pace by the Fed in hiking rates further.
  • The 20-period EMA at 1.3710 might continue to act as a barricade for the US Dollar.

The USD/CAD pair has delivered a less-confident rebound move after dropping to near 1.3650. The Loonie asset seems vulnerable near 1.3700 as a deceleration in the United States inflation is indicating a further decline in appeal for safe-haven assets after the Silicon Valley Bank (SVB) collapse.

S&P500 futures have discovered some losses in the early Asian session as Moody’s Investors Service has cut its view on the entire banking system to negative from stable, as reported by CNBC. The situation is portraying a minor pessimism in the overall risk-on mood.

Softening US inflation is favoring a continuation of a lower pace by the Federal Reserve (Fed) in hiking rates further. Fed chair Jerome Powell should be in no hurry in further policy-tightening as the US inflation is declining according to the directed plans.

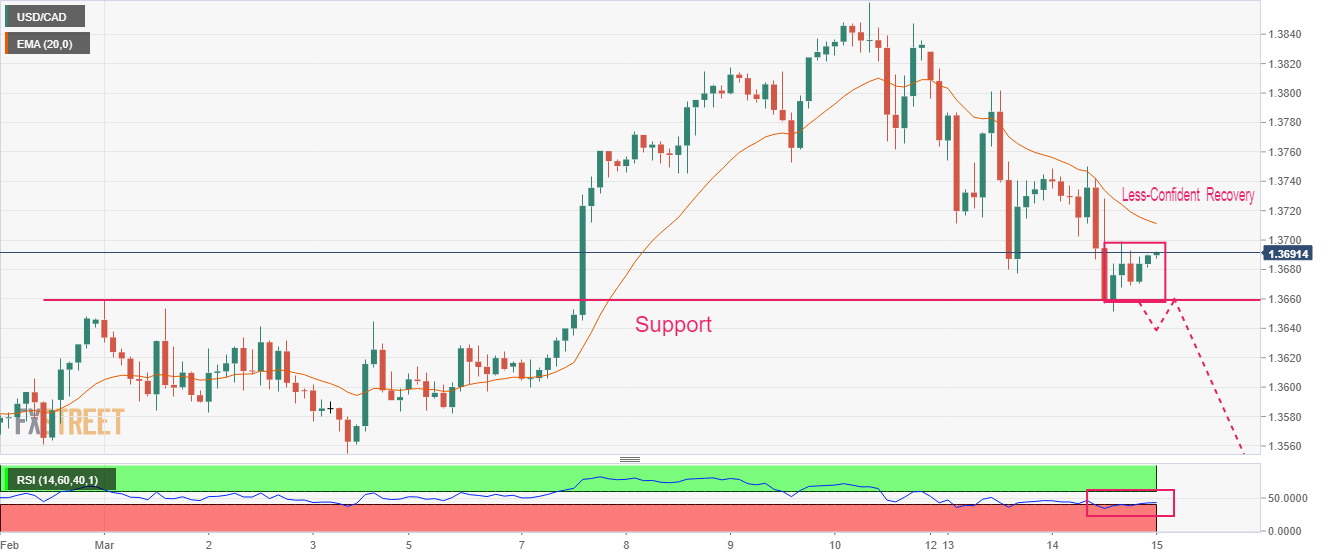
USD/CAD has rebounded after sensing a cushion near the horizontal support plotted from March 01 high at 1.3659 on a two-hour scale. The recovery move by the US Dollar seems to lack confidence and strength, which bolsters the odds of further downside in the asset.

The 20-period Exponential Moving Average (EMA) at 1.3710 might continue to act as a barricade for the US Dollar.

Meanwhile, the Relative Strength Index (RSI) (14) has defended the downside move into the bearish range of 20.00-40.00. However, the downside bias is still intact.

A decisive breakdown of March 14 low at 1.3652 would drag the loonie asset toward March 07 low at 1.3600, followed by March 03 low at 1.3555.

In an alternate scenario, a confident recovery above March 14 high at 1.3750 would drive the major toward March 13 high above 1.3800 and March 09 high at 1.3835.

USD/CAD two-hour chart

USD/CAD

Overview
Today last price1.3691
Today Daily Change0.0006
Today Daily Change %0.04
Today daily open1.3685
 
Trends
Daily SMA201.3613
Daily SMA501.3483
Daily SMA1001.3505
Daily SMA2001.3324
 
Levels
Previous Daily High1.375
Previous Daily Low1.3652
Previous Weekly High1.3862
Previous Weekly Low1.3582
Previous Monthly High1.3666
Previous Monthly Low1.3262
Daily Fibonacci 38.2%1.3689
Daily Fibonacci 61.8%1.3713
Daily Pivot Point S11.3641
Daily Pivot Point S21.3597
Daily Pivot Point S31.3543
Daily Pivot Point R11.374
Daily Pivot Point R21.3794
Daily Pivot Point R31.3838

Author

Sagar Dua

Sagar Dua

FXStreet

Sagar Dua is associated with the financial markets from his college days. Along with pursuing post-graduation in Commerce in 2014, he started his markets training with chart analysis.

More from Sagar Dua
Share:

Editor's Picks

EUR/USD eyes nine-day EMA barrier after rebounding from 1.1600

EUR/USD gains ground after registering modest losses in the previous session, trading around 1.1620 during the Asian hours on Friday. The technical analysis of the daily chart suggests an ongoing bearish bias as the pair remains within the descending channel pattern.

GBP/USD: Pound Sterling ticks up against US Dollar in countdown to US NFP

The Pound Sterling trades marginally higher to near 1.3365 against the US Dollar during the Asian trading session on Friday. The GBP/USD pair edges up as the US Dollar ticks down ahead of the United States Nonfarm Payrolls data for February, which will be published at 13:30 GMT.

Gold awaits US Nonfarm Payrolls for a clear directional impetus

Gold rebounds above $5,100 early Friday after testing the $5,050 level amid global sell-off. The US Dollar pulls back as profit-taking creeps in ahead of US labor data. For February. 21-day SMA holds amid bullish RSI; a daily closing above 61.8% Fibo is critical for Gold buyers.

Ethereum pull in $169M as validators pile in to stake ETH

US spot Ethereum exchange-traded funds recorded $169 million in net inflows on Wednesday, marking the largest daily intake in two months, according to SoSoValue data. The rise in inflows signals renewed institutional interest in Ethereum amid broader market volatility.

The market compass is pointing at a barrel of Oil

The Asian open is arriving with equities leaning the wrong way, and the reason is not complicated. The market’s compass needle has snapped firmly toward crude. In this tape, oil is not just another input price; it is the gravitational center around which every asset class is orbiting.

Ripple tests recovery strength amid steady ETF inflows, growing retail interest

Ripple (XRP) continues to demonstrate notable resilience as the cryptocurrency market navigates the persistent war in the Middle East after the United States (US) and Israel attacked Iran on Saturday.