|

USD/CAD Price Analysis: Rangebound near 1.3450 ahead of Canadian Employment data

  • USD/CAD trades sideways near 1.3450 ahead of Canada’s labor market data.
  • Deepening Middle East tensions continue to provide support to the US Dollar.
  • A lackluster action in the Loonie asset indicates indecisiveness among market participants.

The USD/CAD pair oscillates in a tight range around 1.3450 as investors await the Canadian Employment data for January, which will be published at 13:30 GMT.

Investors anticipate Canadian employers recruiting 15K new workers against flat demand in December. The Unemployment Rate is expected to increase slightly to 5.9% vs. the prior reading of 5.8%. The Bank of Canada (BoC) may focus on keeping interest rates at their current level longer if the labor market conditions remain upbeat.

Meanwhile, the US Dollar Index (DXY) attempts to recover as market mood remains cautious due to deepening Middle East tensions. Israel denies the ceasefire proposal from Hamas having unacceptable terms. Also, investors await January's United States inflation data, which will be published on Tuesday. Investors see price pressures expanding at a steady pace.

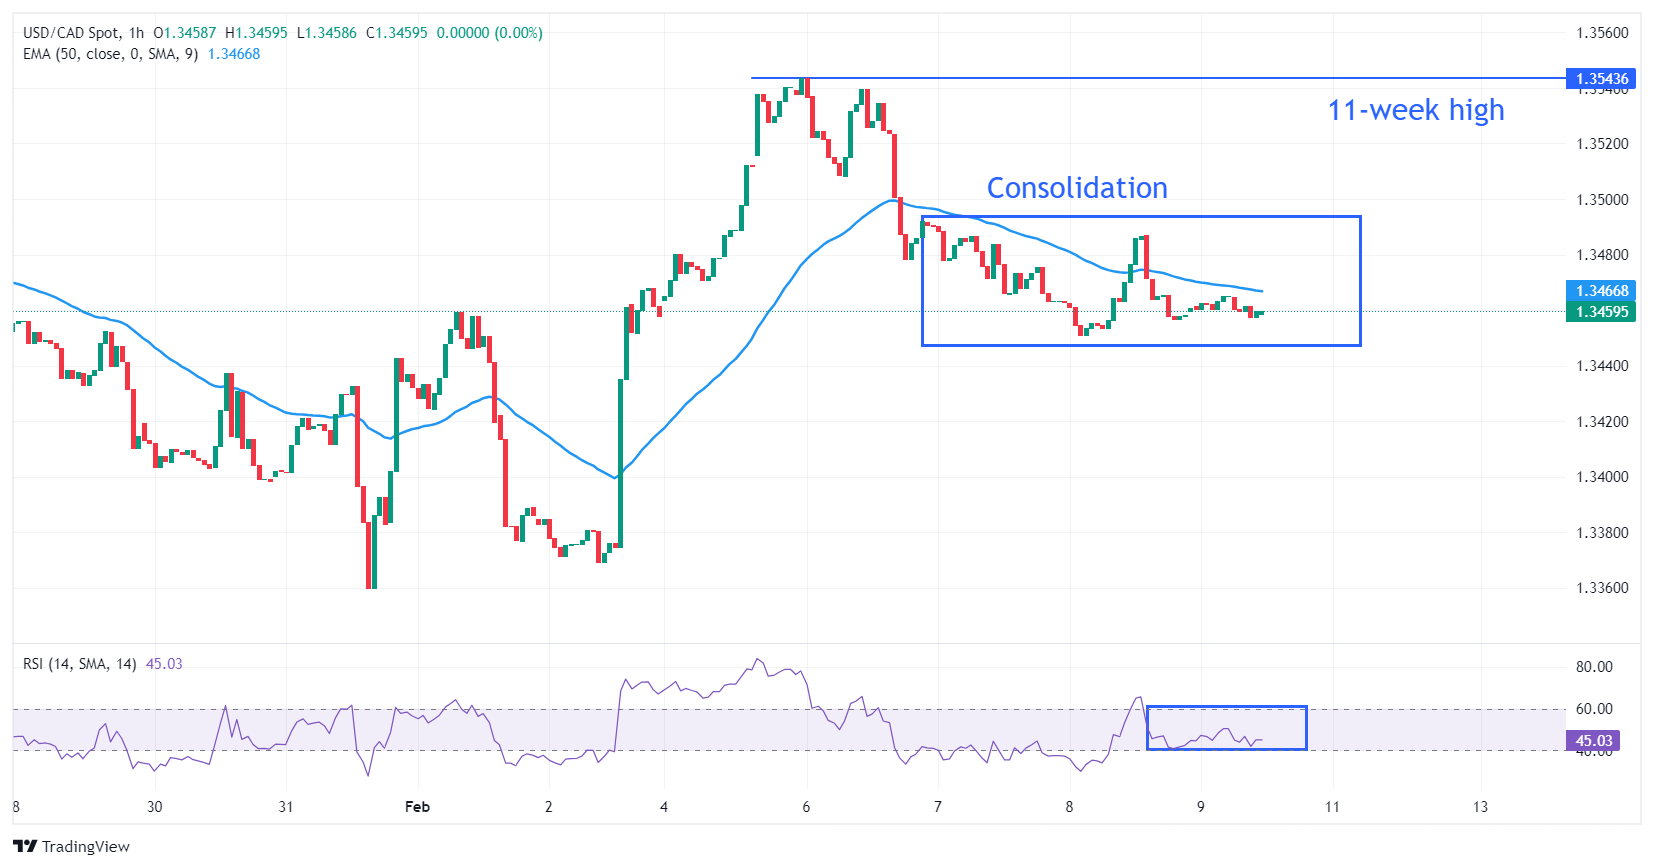
USD/CAD turns sideways in a range of 1.3450-1.3500 after correction from an 11-week high of 1.3544 on an hourly scale. The Loonie asset struggles for a direction ahead of crucial labor market data. The 50-period Exponential Moving Average (EMA) around 1.3460 has overlapped the Loonie asset, indicating a sharp contraction in volatility.

The 14-period Relative Strength Index (RSI) oscillates in the 40.00-60.00 range, indicating a sideways trend.

The fresh upside would emerge if the Loonie asset climbed above the January 17 high at 1.3542, which will drive the asset towards the round-level resistance of 1.3600, followed by the November 30 high at 1.3627.

On the flip side, a sell-off could appear if the Loonie asset drops below January 31 low at 1.3359. This will expose the asset to January 4 low at 1.3318 and January 5 low at 1.3288.

USD/CAD hourly chart

USD/CAD

Overview
Today last price1.346
Today Daily Change0.0002
Today Daily Change %0.01
Today daily open1.3458
 
Trends
Daily SMA201.3461
Daily SMA501.3421
Daily SMA1001.3553
Daily SMA2001.3476
 
Levels
Previous Daily High1.3493
Previous Daily Low1.3448
Previous Weekly High1.3476
Previous Weekly Low1.3359
Previous Monthly High1.3542
Previous Monthly Low1.3229
Daily Fibonacci 38.2%1.3465
Daily Fibonacci 61.8%1.3476
Daily Pivot Point S11.3439
Daily Pivot Point S21.3421
Daily Pivot Point S31.3394
Daily Pivot Point R11.3485
Daily Pivot Point R21.3512
Daily Pivot Point R31.353

Author

Sagar Dua

Sagar Dua

FXStreet

Sagar Dua is associated with the financial markets from his college days. Along with pursuing post-graduation in Commerce in 2014, he started his markets training with chart analysis.

More from Sagar Dua
Share:

Editor's Picks

AUD/USD eyes 0.7150 barrier nine-day EMA

AUD/USD inches higher after registering modest losses in the previous day, trading around 0.7130 during the Asian hours. The technical analysis of the daily chart indicates that the pair is moving sideways within the rectangle pattern, suggesting a consolidation as neither the bulls nor the bears have enough momentum to take control of the market.

USD/JPY trades below 160.00 intervention threshold; bullish bias intact

The USD/JPY pair attracts some sellers during the Asian session amid fears that authorities will step in again to prop up the Japanese Yen. Furthermore, the Israel-Lebanon truce prompts some profit-taking around the US Dollar and exerts downward pressure on the currency pair.

Gold defends 200-day SMA at $4,425, but for how long?

Gold is attempting a tepid recovery toward $4,500 early Thursday, as renewed optimism in the Mideast geopolitical front calms market nerves. This cautious optimism across Asian markets weighs on Oil prices, and diminishes the US Dollar’s safe-haven appeal, helping Gold stage a decent comeback from the weekly low of $4,424.


Hyperliquid: ETF demand, capital rotation fuel HYPE rally as Bitcoin melts

Hyperliquid price sustains an upward trend near its all-time high of $75.76 on Thursday after posting 80% gains in May, while Bitcoin (BTC) retraces below $65,000, triggering a market-wide panic.

Kevin Warsh takes the Fed helm: What it means for the US Dollar
The Federal Reserve moves away from the highly predictable "forward guidance" model of the Jerome Powell era to a new “Kevin Warsh environment”, characterized by less communication, more policy surprises, and an increased focus on the Fed's complex balance sheet.
Recession on paper: What really moves the Canadian Loonie now?

Statistics Canada handed the headline writers a gift and the analysts a headache. Real GDP shrank 0.1% on an annualized basis in the first quarter, and with the fourth quarter of 2025 revised down to a 1.0% contraction, that is two negative quarters in a row, the textbook definition of a technical recession and Canada's first since the pandemic.