|

USD/CAD Price Analysis: Prepares for an impulsive move ahead of US/Canada Employment report

  • USD/CAD is oscillating in a tad wider range ahead of labor market reports.
  • The market mood remains upbeat as investors shrug off volatility triggered by Fitch’s downgrade.
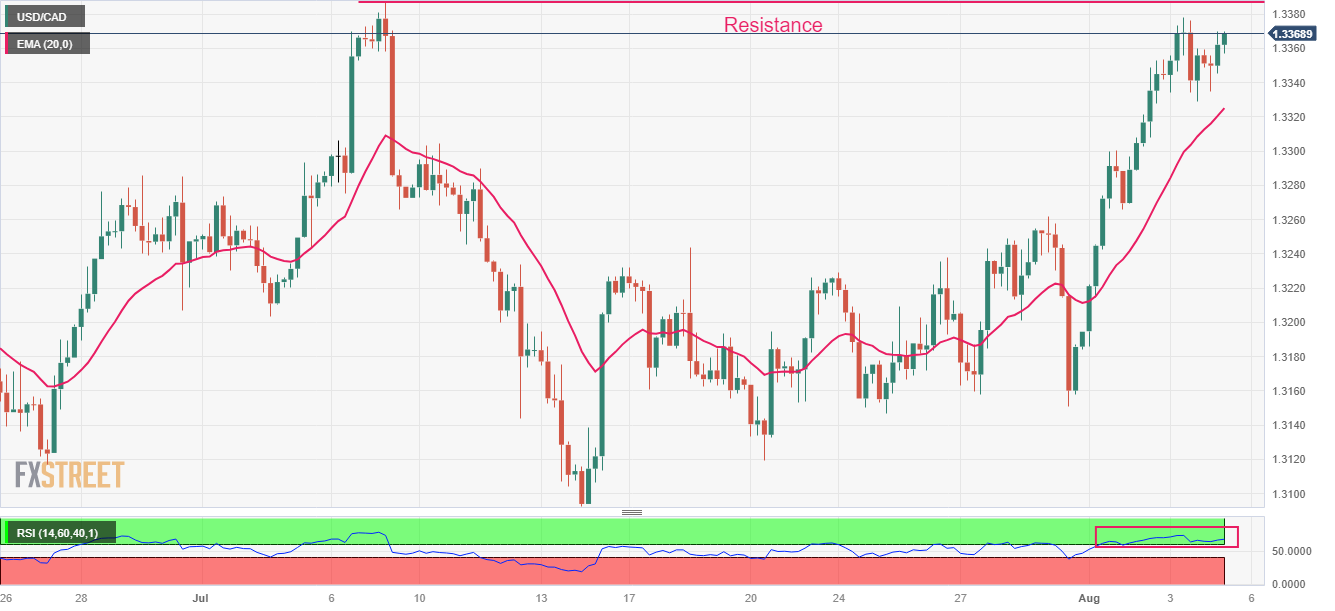
  • USD/CAD reaches near the horizontal resistance plotted around 1.3387.

The USD/CAD pair rebounds after a modest corrective move to near 1.3330 in the London session. The Loonie asset is expected to remain sidelined as investors are awaiting the employment data of the United States and Canada.

US Unemployment Rate is seen steady at 3.6% while Canada’s jobless rate could increase to 5.5% vs. the former release of 5.4%. The US Dollar Index (DXY) manages to remain well supported above the immediate support of 102.40. Meanwhile, the market mood remains upbeat as investors shrug off volatility triggered by Fitch’s downgrade to the US government's long-term debt rating.

On Thursday, US Services PMI and its forward demand underperformed expectations as the burden of high inflation squeezes deep pockets of households. The labor cost index is growing at a slower pace, reducing the spending capacity of individuals.

After a vertical north-side move, the USD/CAD pair reaches near the horizontal resistance plotted from July 07 high around 1.3387 on a four-hour scale. Upward-sloping 20-period Exponential Moving Average (EMA) at 1.3322 indicates that the bullish bias is extremely solid.

The Relative Strength Index (RSI) (14) climbs into the bullish range of 60.00-80.00, which indicates that the upside momentum is already active.

A decisive break above the July 07 high around 1.3387 would open a fresh upside, which will drive the asset towards the June 7 high at 1.3427, followed by the psychological resistance of 1.3500.

In an alternate scenario, a downside move below July 18 high at 1.3288 would drag the asset toward July 27 low around 1.3160 and July 14 low marginally below 1.3100.

USD/CAD four-hour chart

USD/CAD

Overview
Today last price1.3364
Today Daily Change0.0011
Today Daily Change %0.08
Today daily open1.3353
 
Trends
Daily SMA201.3221
Daily SMA501.3284
Daily SMA1001.3406
Daily SMA2001.3457
 
Levels
Previous Daily High1.3378
Previous Daily Low1.3329
Previous Weekly High1.3255
Previous Weekly Low1.3147
Previous Monthly High1.3387
Previous Monthly Low1.3093
Daily Fibonacci 38.2%1.3359
Daily Fibonacci 61.8%1.3348
Daily Pivot Point S11.3329
Daily Pivot Point S21.3304
Daily Pivot Point S31.328
Daily Pivot Point R11.3378
Daily Pivot Point R21.3403
Daily Pivot Point R31.3427

Author

Sagar Dua

Sagar Dua

FXStreet

Sagar Dua is associated with the financial markets from his college days. Along with pursuing post-graduation in Commerce in 2014, he started his markets training with chart analysis.

More from Sagar Dua
Share:

Editor's Picks

EUR/USD slumps below 1.1750 as USD benefits from risk-aversion

EUR/USD comes under renewed bearish pressure in the European session and trades below 1.1750 following a recovery attempt earlier in the day. The US Dollar gathers strength and weighs on the pair as investors seek refuge in the wake of Israel and the United States' joint attack on Iran.

GBP/USD targets 1.3500 barrier near moving averages

GBP/USD rebounds from the daily losses, trading around 1.3450 during the Asian hours on Monday. The technical analysis of the daily chart indicates an ongoing bearish bias, as the pair trades within a descending channel pattern.

Gold surges on safe-haven demand, tests $5,400

Gold benefits from intense risk-aversion on Monday and climbs to the $5,400 region, setting a fresh monthly-high in the process. Tensions in the Middle East remain high as Israel and Hezbollah continue to exchange strikes following the US-Israel joint attack on Iran over the weekend.

Bitcoin on brink of breakdown amid US-Iran war

Bitcoin (BTC) remains under pressure near the key support level of $65,700. Trading at $66,400 at the time of writing on Monday, a breakdown below this critical level would suggest a deeper correction ahead.

The week ahead: Conflict in the Middle East jolts markets

Events in the Middle East are obviously dominating financial markets this morning. The Brent crude oil price is extending gains and is higher by more than 8%, stock futures are pointing lower and the gold price is higher by more than 2%. 

Pi Network Price Forecast: Core team offloads supply, weighing on PI recovery

Pi Network  hovers below $0.1700, broadly steady at press time on Monday, attempting a recovery after a 2% loss the previous day. Sunday’s decline aligned with nearly 49 million PI tokens offloaded by the Pi Foundation, implying a spike in supply pressure that capped the prevailing four-day recovery.