|

USD/CAD Price Analysis: Loonie bulls attack multi-day-old resistance of 1.3610 ahead of key catalysts

  • USD/CAD picks up bids to reverse the week-start retreat, poking downward-sloping resistance line from late April at the latest.
  • Sustained trading beyond the key Fibonacci ratio, 21-DMA favor Loonie pair buyers.
  • Nearly overbought RSI line suggests pullback; bulls should remain cautious below 1.3670.
USD/CAD Price Analysis: Loonie bulls attack multi-day-old resistance of 1.3610 ahead of key catalysts

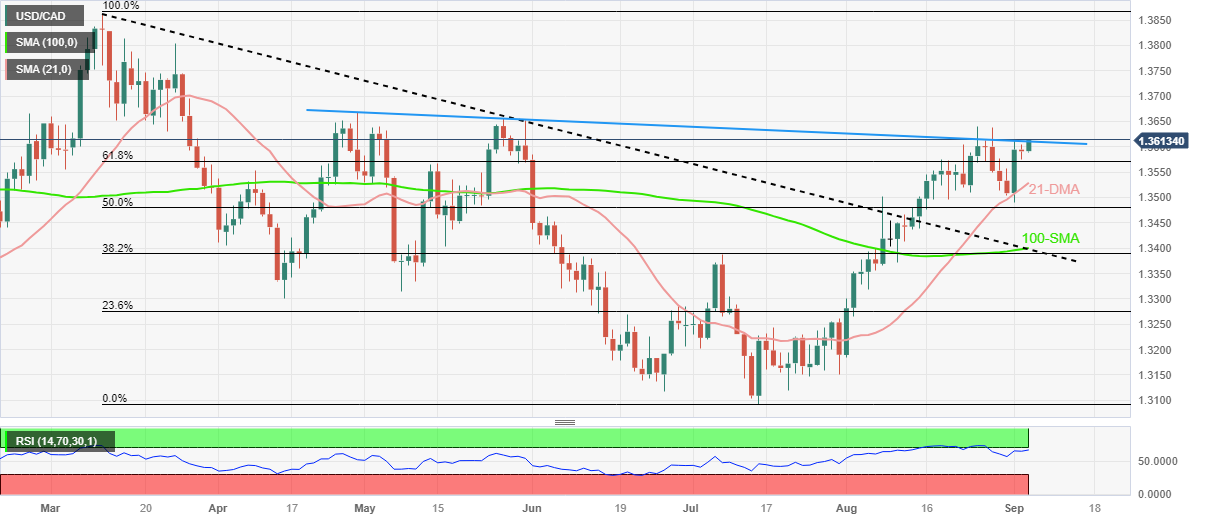
USD/CAD pierces the 1.3600 threshold as buyers attack a downward-sloping resistance line from late April amid the very early Tuesday morning in Europe.

Also read: USD/CAD trades sideways below the 1.3600 mark, BoC rate decision, US Services PMI eyed

The Loonie pair justified overbought conditions of the RSI (14) line to retreat the previous day. Even so, the quote stayed beyond the 61.8% Fibonacci retracement of the March–July downside, not to mention its defense of the recovery from the 21-DMA.

Also keeping the USD/CAD buyers hopeful is the early-August run-up beyond the six-month-old previous resistance line.

Hence, the quote stays on the bull’s radar but the further upside appears limited, which in turn highlights the immediate resistance line surrounding 1.3610.

Following that, the previous monthly high of 1.3640 will precede the tops marked in May and April, respectively near 1.3655 and 1.3670, to challenge the USD/CAD buyers.

In a case where the Loonie pair buyers keep the reins past 1.3670, the odds of witnessing its gradual rise toward March’s peak of 1.3861 can’t be ruled out.

On the contrary, a daily closing beneath the 61.8% Fibonacci ratio and the 21-DMA, respectively near 1.3570 and 1.3530, becomes necessary to recall the USD/CAD bears.

In those conditions, the 50% Fibonacci retracement level of .3480 could lure the USD/CAD sellers before challenging them with the 1.3400 support confluence comprising the 100-DMA and previous resistance line stretched from early March.

USD/CAD: Daily chart
Trend: Pullback expected

Additional important levels

Overview
Today last price1.3607
Today Daily Change0.0016
Today Daily Change %0.12%
Today daily open1.3591
 
Trends
Daily SMA201.3525
Daily SMA501.3355
Daily SMA1001.3398
Daily SMA2001.3464
 
Levels
Previous Daily High1.3605
Previous Daily Low1.3576
Previous Weekly High1.3637
Previous Weekly Low1.3489
Previous Monthly High1.364
Previous Monthly Low1.3184
Daily Fibonacci 38.2%1.3587
Daily Fibonacci 61.8%1.3593
Daily Pivot Point S11.3576
Daily Pivot Point S21.3561
Daily Pivot Point S31.3547
Daily Pivot Point R11.3605
Daily Pivot Point R21.362
Daily Pivot Point R31.3634

Author

Anil Panchal

Anil Panchal

FXStreet

Anil Panchal has nearly 15 years of experience in tracking financial markets. With a keen interest in macroeconomics, Anil aptly tracks global news/updates and stays well-informed about the global financial moves and their implications.


More from Anil Panchal
Share:

Editor's Picks

AUD/USD remains depressed below 0.6750 after RBA minutes

AUD/USD treads water below 0.6750 in Asia on Tuesday, struggling near ten-month lows. The pair fails to find any inspiration from RBA Governor Bullock’s hawkish remarks. Moreover, Minutes from the November RBA meeting also had little impact on the Australian Dollar amid a bullish US Dollar undertone, bolstered by firming Fed hike bets and geopolitical uncertainties.

USD/JPY holds steady around 156.50 as 'Yentervention' risks loom

USD/JPY is consolidating around mid-156.00s in the Asian session on Tuesday as traders stay on high alert amid speculation that authorities will step in to support the Japanese Yen. Meanwhile, the US Dollar holds its recent gains at a 19-month high, amid firming Fed rate-hike bets and geopolitical uncertainty. This, along with the wide US-Japan rate differential, acts as a tailwind for the pair.


Gold stays vulnerable amid Fed hike bets, geopolitical uncertainty

Gold sellers take a breather before targeting October 2025 lows near $3,820 early Tuesday. US Dollar renews 19-month highs amid US-Iran woes and hawkish Fed rhetoric. Gold’s daily technical setup suggests downside risks remain ahead of Wednesday’s Fed Minutes.

What to watch this week as Bitcoin falls below $65K
Bitcoin holds below $65,000 on Monday amid ongoing selling pressure across cryptocurrency markets, facing a growing number of headwinds. Hawkish Federal Reserve expectations, concerns over the regulatory outlook and potential rotation out of crypto ahead of Anthropic's IPO have all raised concerns about the price.
The week ahead: Questions for the new Nvidia CEO, Anthropic’s IPO and economic data dump
The tech stock rout does not look to be over, and could be broadening as we start a new week. Nvidia’s stock price is lower by another 2% in the pre market, and its rivals, that had benefited from the chip giant’s initial demise, are also playing catch up this morning. AMD’s share price is lower by 4.2% in early trading, even though it eked out a gain last week.
Gold isn't being sold for thew reason most people think
Gold (XAU/USD) remains under heavy selling pressure on Monday, hitting its lowest level in 13 months. The precious metal is struggling to recover despite escalating geopolitical tensions in the Middle East, a backdrop that would normally encourage investors to seek protection in safe-haven assets. However, the main driver behind Gold's decline is not the geopolitical uncertainty itself.