|

USD/CAD Price Analysis: Keeps the bearish vibe unchanged above the 1.3400 mark

  • USD/CAD loses traction near 1.3407 despite the firmer US Dollar. 
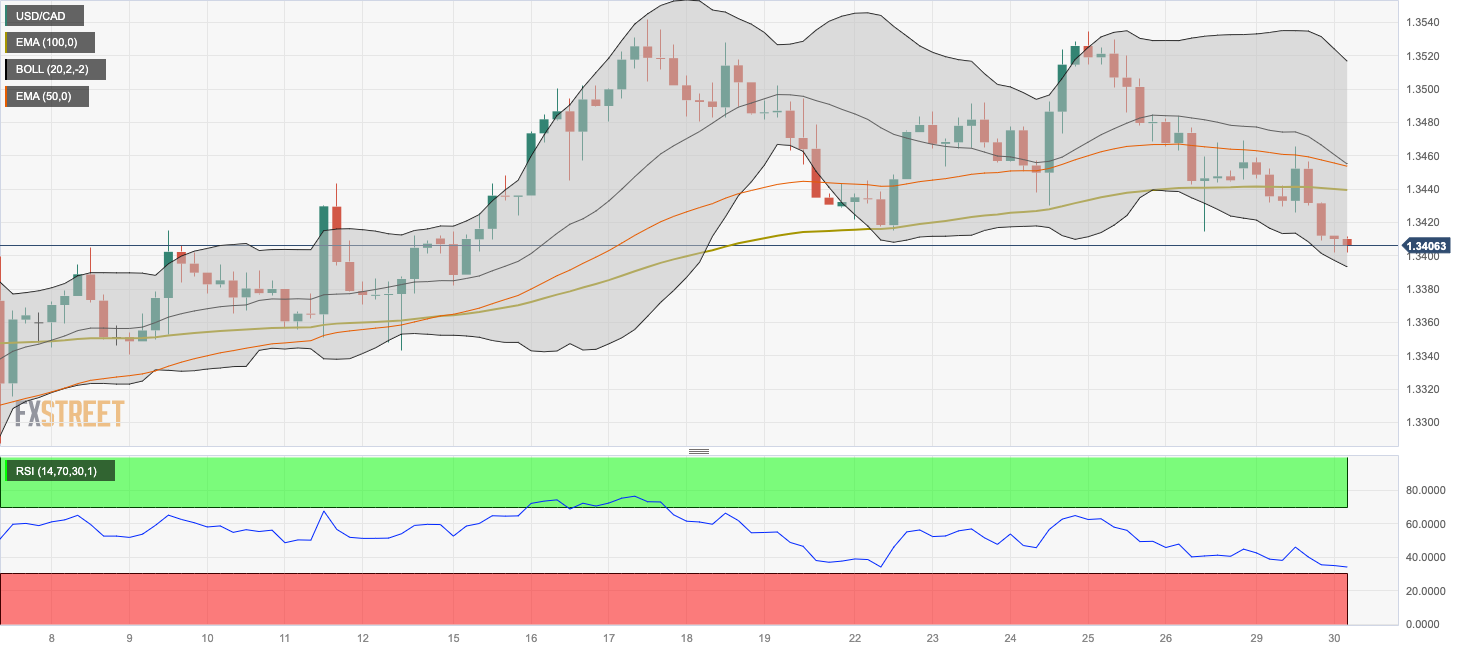
  • The bearish outlook remains intact below the key EMA; RSI indicator is located in the bearish territory below the 50 midline.
  • The first support level is seen at 1.3350; the immediate resistance level will emerge at 1.3440.

The USD/CAD pair trades on a softer note for the fourth consecutive day during the early European session on Tuesday. The higher oil prices amid the ongoing geopolitical tensions in the Middle East lift the commodity-linked Loonie and weigh on the USD/CAD pair. The pair currently trades around 1.3405, losing 0.04% on the day. 

Technically, USD/CAD keeps the bearish bias unchanged as the pair is below the 50- and 100-period Exponential Moving Averages (EMA) on the four-hour chart. The path of the least resistance of USD/CAD is to the downside, as the Relative Strength Index (RSI) stands in bearish territory below the 50-midline.

A bearish breakout below the lower limit of the Bollinger Band at 1.3393 will see a drop to a low of January 11 at 1.3350. Any follow-through selling below the latter will expose the 1.3300 psychological support level, en route to a low of January 2 at 1.3228.

On the upside, the first upside barrier of the pair is located at the 100-period EMA at 1.3440. The additional upside filter to watch is the 50-period EMA at 1.3450. Further north, the next hurdle will emerge at the upper boundary of the Bollinger Band at 1.3516, followed by a high of January 25 at 1.3534.

USD/CAD four-hour chart

(This story was corrected on January 30 at 07:33 GMT to say, in the headline, first bullet point, and first paragraph, that the USD/CAD pair is trading around the 1.3400s, not 1.3700s.)

USD/CAD

Overview
Today last price1.3406
Today Daily Change-0.0004
Today Daily Change %-0.03
Today daily open1.3410
 
Trends
Daily SMA201.3426
Daily SMA501.3450
Daily SMA1001.3557
Daily SMA2001.3481
 
Levels
Previous Daily High1.3469
Previous Daily Low1.3410
Previous Weekly High1.3535
Previous Weekly Low1.3414
Previous Monthly High1.3620
Previous Monthly Low1.3178
Daily Fibonacci 38.2%1.3433
Daily Fibonacci 61.8%1.3447
Daily Pivot Point S11.3390
Daily Pivot Point S21.3371
Daily Pivot Point S31.3331
Daily Pivot Point R11.3450
Daily Pivot Point R21.3489
Daily Pivot Point R31.3509

Author

Lallalit Srijandorn

Lallalit Srijandorn is a Parisian at heart. She has lived in France since 2019 and now becomes a digital entrepreneur based in Paris and Bangkok.

More from Lallalit Srijandorn
Share:

Markets move fast. We move first.

Orange Juice Newsletter brings you expert driven insights - not headlines. Every day on your inbox.

By subscribing you agree to our Terms and conditions.

Editor's Picks

EUR/USD eyes 1.1800 barrier near two-month highs

EUR/USD extends its gains for the second successive session, trading around 1.1780 during the Asian hours on Tuesday. On the daily chart, technical analysis indicates a persistent bullish bias, as the pair moves upward within the ascending channel pattern. Additionally, the 14-day Relative Strength Index at 68.89 sits near overbought, signaling strong demand. RSI remains elevated, which could cap gains if overbought conditions emerge.

GBP/USD knocks ten-week highs ahead of holiday slowdown

GBP/USD found room on the high side on Monday, kicking off a holiday-shortened trading week with a fresh spat of Greenback weakness, bolstering the Pound Sterling into its highest bids in ten weeks. Pound traders are largely brushing off the latest interest rate cut from the Bank of England as the UK’s central bank policy strategy leaves the water murky for rate-cut watchers.

Gold bulls seem unstoppable amid supportive fundamental backdrop

Gold is seen building on the previous day's strong rally of over 2% and continues scaling new all-time highs for the second consecutive day on Tuesday. The commodity climbs closer to the $4,500 psychological mark during the Asian session and remains well supported by a combination of factors. 

Uniswap holds above $6 as traders eye UNIfication vote outcome

Uniswap price holds above $6 at the time of writing on Tuesday after closing above a key resistance zone in the previous week. Traders are focusing on the highly anticipated UNIfication proposal, which is set to conclude on Thursday, and could become a key near-term catalyst. On the technical side, momentum indicators are flashing bullish signals, hinting at an upside rally.

Ten questions that matter going into 2026

2026 may be less about a neat “base case” and more about a regime shift—the market can reprice what matters most (growth, inflation, fiscal, geopolitics, concentration). The biggest trap is false comfort: the same trades can look defensive… right up until they become crowded.

XRP steadies above $1.90 support as fund inflows and retail demand rise

Ripple (XRP) is stable above support at $1.90 at the time of writing on Monday, after several attempts to break above the $2.00 hurdle failed to materialize last week. Meanwhile, institutional interest in the cross-border remittance token has remained steady.