|

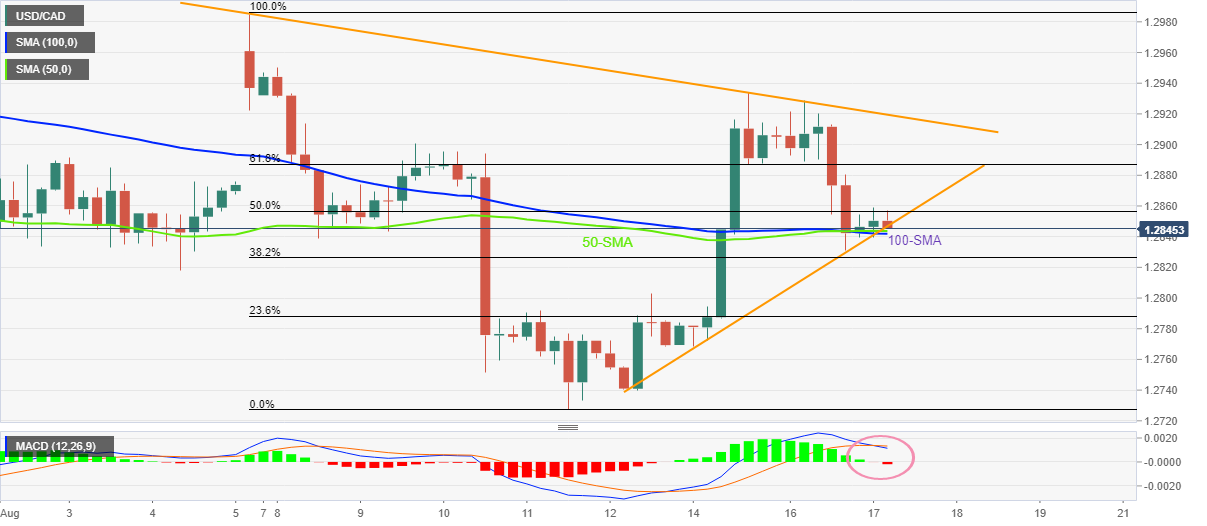
USD/CAD Price Analysis: Fades bounce off 50/100-SMA around 1.2850

  • USD/CAD picks up bids to consolidate Tuesday’s losses amid sluggish session.
  • Impending bear cross on MACD keeps sellers hopeful.
  • Four-day-old support line adds to the downside filter.

USD/CAD struggles to defend the corrective pullback from the key moving averages as the quote retreats to 1.2850 during early Wednesday morning in Europe.

In doing so, the Loonie pair drops back to the upward sloping support line from August 12 as the MACD teases sellers.

Considering the quote’s failure to keep the bounce off the 100-SMA and 50-SMA, as well as the bearish MACD signals, the USD/CAD prices are likely to remain soft.

However, a clear downside break of the stated support line and the SMA confluence, around 1.2845-40, becomes necessary for the pair bears to retake control.

Following that, a slump towards the 23.6% Fibonacci retracement level of August 05-11, near 1.2790, can’t be ruled out.

Meanwhile, recovery moves need to cross the 61.8% Fibonacci retracement level of 1.2890 to convince buyers.

Even so, a downward sloping resistance line from August 05, close to 1.2920, could act as the last defense of the USD/CAD bears.

Overall, USD/CAD is likely to remain sidelined, weak for the short-term, as traders await the key Fed Minutes.

USD/CAD: Four-hour chart

Trend: Further weakness expected

Additional important levels

Overview
Today last price1.2849
Today Daily Change0.0004
Today Daily Change %0.03%
Today daily open1.2845
 
Trends
Daily SMA201.2851
Daily SMA501.2895
Daily SMA1001.2806
Daily SMA2001.275
 
Levels
Previous Daily High1.2929
Previous Daily Low1.2831
Previous Weekly High1.295
Previous Weekly Low1.2728
Previous Monthly High1.3224
Previous Monthly Low1.2789
Daily Fibonacci 38.2%1.2868
Daily Fibonacci 61.8%1.2891
Daily Pivot Point S11.2808
Daily Pivot Point S21.2771
Daily Pivot Point S31.271
Daily Pivot Point R11.2906
Daily Pivot Point R21.2966
Daily Pivot Point R31.3003

Author

Anil Panchal

Anil Panchal

FXStreet

Anil Panchal has nearly 15 years of experience in tracking financial markets. With a keen interest in macroeconomics, Anil aptly tracks global news/updates and stays well-informed about the global financial moves and their implications.

More from Anil Panchal
Share:

Editor's Picks

EUR/USD seems fragile below 1.1700 as Middle East war boosts energy prices

The EUR/USD pair trades flat at around 1.1680 during the Asian trading session on Tuesday, but broadly seems vulnerable, being close to its five-week low. The major currency pair is under pressure as surging oil prices due to the United States-Israel war with Iran have increased the risks of higher inflation for the Old Continent.

GBP/USD hovers around 1.3400 with bearish pressure intact

GBP/USD edges higher after three days of losses, trading around 1.3400 during the Asian hours on Tuesday. The technical analysis of the daily chart indicates an ongoing bearish bias, as the pair trades within a descending channel pattern.

Gold weakens below $5,300 as sustained USD buying counter Middle East tensions

Gold attracts some intraday selling and falls around $100 from the daily top, around the $5,380 area. The US Dollar climbs to a fresh high since January 20 and turns  out to be a key factor exerting downward pressure on the commodity. However, concerns about a broader regional conflict in the Middle East continue to weigh on investors' sentiment and underpin demand for the traditional safe-haven bullion.

Stellar risks deeper losses as derivatives metrics turn negative

Stellar is trading red below $0.16 at the time of writing on Tuesday, after a slight recovery the previous day. Weakening derivatives data caps the recovery, while an unfavorable technical outlook projects a deeper correction for the XLM token in the upcoming days.

The market is not panicking it is repricing the probability distribution of Oil and time

At the end of the day, markets do not trade morality or geopolitics. They trade transmission channels. And the only channel that truly matters in this maelstrom runs through the price of energy and the time value of money.

Hyperliquid Price Forecast: HYPE rises on commodities demand amid US-Iran war

Hyperliquid (HYPE) steadies above $33 at press time on Tuesday, marking its fourth consecutive day of recovery in a broadly volatile market due to the ongoing US-Israel strikes on Iran.