|

USD/CAD Price Analysis: Fades bounce off 21-DMA below 1.3600, eyes on BoC, Canada employment

  • USD/CAD pares the biggest daily gain in a month as market consolidates Friday’s moves amid US Labor Day holiday.
  • Bearish MACD signals, failure to cross key resistance line lure Loonie sellers.
  • Intraday sellers eyed Golden Fibonacci Ratio ahead of the key DMAs.
  • Bulls need validation from multiple technical, fundamental catalysts.

USD/CAD clings to mild losses around 1.3585 heading into Monday’s European session as market players consolidate Friday’s heavy gains amid a sluggish start to the week’s trading.

In doing so, the Loonie pair aptly portrays the USD/CAD pair trader’s cautious mood ahead of the Bank of Canada (BoC) Interest Rate Decision, as well as the Canadian employment data for August.

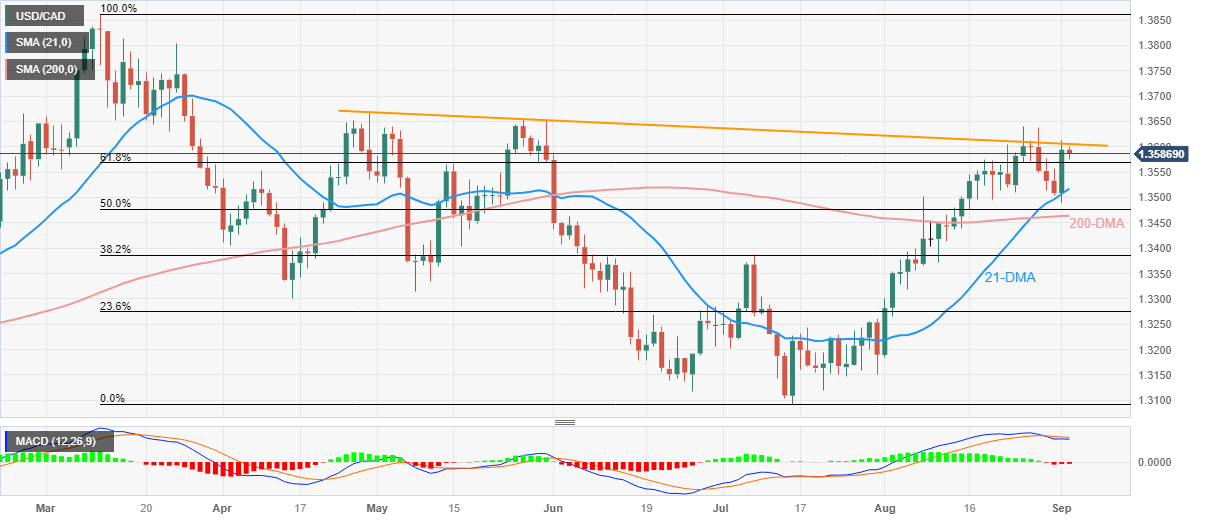
Technically, the bearish MACD signals join the USD/CAD pair’s U-turn from a downward-sloping resistance line from late April, around 1.3610 at the latest, keeping the Loonie pair sellers hopeful.

However, a daily closing beneath the 61.8% Fibonacci retracement of its March–July downside, near 1.3570, becomes necessary to convince intraday sellers of the USD/CAD. It’s worth noting that the stated Fibonacci retracement is also known as the Golden Fibonacci ratio.

Following that, the 21-DMA and 200-DMA, respectively near 1.3520 and 1.3465, will act as the final defense of the USD/CAD buyers.

Meanwhile, a daily closing beyond the aforementioned resistance line stretched from April, close to 1.3610 at the latest, could convince the USD/CAD bulls to prod the previous monthly high of around 1.3640.

In a case where the Loonie pair buyers keep the reins, the tops marked in May and April, close to 1.3655 and 1.3670, could act as additional upside filters before directing the prices toward the yearly top marked in March around 1.3860.

USD/CAD: Daily chart

Trend: Pullback expected

Additional important levels

Overview
Today last price1.3585
Today Daily Change-0.0009
Today Daily Change %-0.07%
Today daily open1.3594
 
Trends
Daily SMA201.3514
Daily SMA501.3346
Daily SMA1001.3396
Daily SMA2001.3464
 
Levels
Previous Daily High1.3613
Previous Daily Low1.3489
Previous Weekly High1.3637
Previous Weekly Low1.3489
Previous Monthly High1.364
Previous Monthly Low1.3184
Daily Fibonacci 38.2%1.3566
Daily Fibonacci 61.8%1.3536
Daily Pivot Point S11.3518
Daily Pivot Point S21.3442
Daily Pivot Point S31.3395
Daily Pivot Point R11.3642
Daily Pivot Point R21.3689
Daily Pivot Point R31.3765

Author

Anil Panchal

Anil Panchal

FXStreet

Anil Panchal has nearly 15 years of experience in tracking financial markets. With a keen interest in macroeconomics, Anil aptly tracks global news/updates and stays well-informed about the global financial moves and their implications.

More from Anil Panchal
Share:

Editor's Picks

EUR/USD deflates to fresh lows, targets 1.1600

The selling pressure on EUR/USD now gathers extra pace, prompting the pair to hit fresh multi-week lows in the 1.1625-1.1620 band on Friday. The continuation of the downward bias comes in response to further gains in the US Dollar as market participants continue to assess the mixed release of US Nonfarm Payrolls in December.

GBP/USD breaks below 1.3400, challenges the 200-day SMA

GBP/USD remains under heavy fire and retreats for the fourth consecutive day on Friday. Indeed, Cable suffers the strong performance of the Greenback, intensified post-mixed NFP, and trades at shouting distance from its critical 200-day SMA near 1.3380.

Gold flirts with yearly tops around $4,500

Gold keeps its positive bias on Friday, adding to Thursday’s advance and challenging yearly highs in the $4,500 region per troy ounce. The risk-off sentiment favours the yellow metal despite the firmer tone in the Greenback and rising US Treasury yields.

Crypto Today: Bitcoin, Ethereum, XRP risk further decline as market fear persists amid slowing demand

Bitcoin holds $90,000 but stays below the 50-day EMA as institutional demand wanes. Ethereum steadies above $3,000 but remains structurally weak due to ETF outflows. XRP ETFs resume inflows, but the price struggles to gain ground above key support.

Week ahead – US CPI might challenge the geopolitics-boosted Dollar

Geopolitics may try to steal the limelight from US data. A possible US Supreme Court ruling on tariffs could dictate market movements. A crammed data calendar next week, US CPI comes on Tuesday; Fedspeak to intensify.

XRP trades under pressure amid weak retail demand

XRP presses down on the 50-day EMA support as risk-averse sentiment spreads despite a positive start to 2026. XRP faces declining retail demand, as reflected in futures Open Interest, which has fallen to $4.15 billion.