|

USD/CAD Price Analysis: Depreciates to near 1.3500 followed by 23.6% Fibonacci

  • USD/CAD loses ground to a major level of 1.3500 on Tuesday.
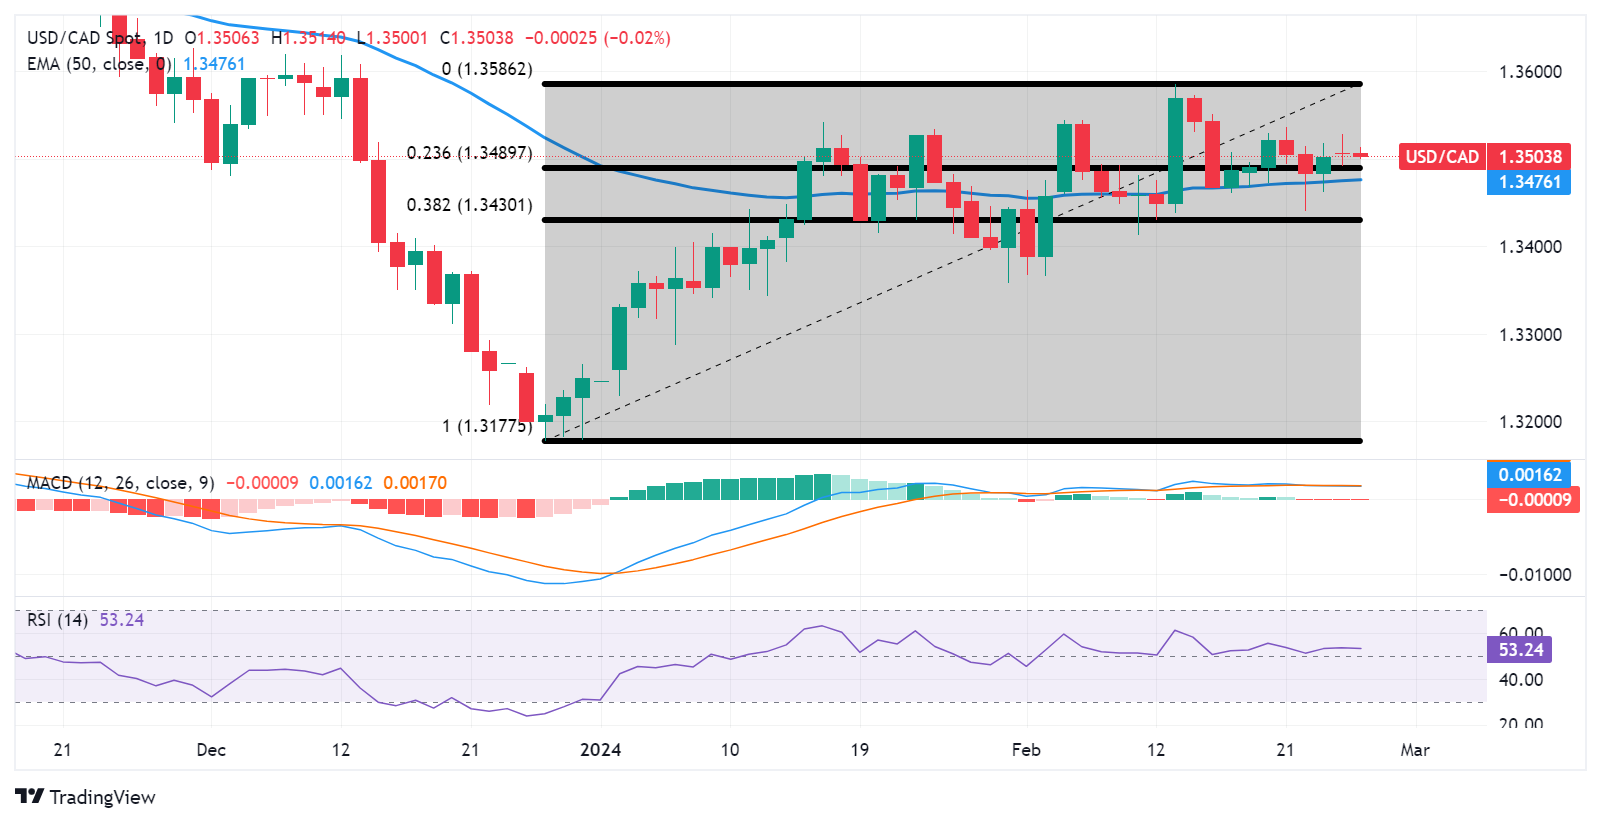
  • The immediate support area appears around the 23.6% Fibonacci retracement level at 1.3489 and 50-day EMA at 1.3476.
  • The pair could find immediate resistance around the major level of 1.3550 and February’s high at 1.3586.

USD/CAD continues to lose ground on the subdued US Dollar (USD), which could be attributed to the lower US Treasury yields. The USD/CAD pair inches lower to near 1.3500 during the Asian session on Tuesday.

The USD/CAD pair could find the immediate support region around the 23.6% Fibonacci retracement level at 1.3489 and the 50-day Exponential Moving Average (EMA) at 1.3476. A break below the latter could prompt the pair to approach the major level of 1.3450 before the 38.2% Fibonacci retracement level at 1.3430. Further support appears at the psychological support at the 1.3400 level.

The technical analysis of the 14-day Relative Strength Index (RSI) is positioned above 50, suggesting bullish momentum for the USD/CAD pair.

Furthermore, the Moving Average Convergence Divergence (MACD) indicator for the USD/CAD pair, indicates a subdued momentum in the market. This interpretation is based on the MACD line's position above the centerline but lies below the signal line. Traders could await a clearer directional signal from the lagging indicator MACD before making aggressive trades in the pair.

On the upside, the USD/CAD pair could meet the key resistance at the major level of 1.3550 following February’s high at 1.3586. A break above February’s high could exert upward support to lead the pair to explore the region around the psychological resistance level at 1.3600.

USD/CAD: Daily Chart

USD/CAD

Overview
Today last price1.3505
Today Daily Change-0.0001
Today Daily Change %-0.01
Today daily open1.3506
 
Trends
Daily SMA201.3481
Daily SMA501.3416
Daily SMA1001.3542
Daily SMA2001.3478
 
Levels
Previous Daily High1.3529
Previous Daily Low1.3492
Previous Weekly High1.3536
Previous Weekly Low1.3441
Previous Monthly High1.3542
Previous Monthly Low1.3229
Daily Fibonacci 38.2%1.3506
Daily Fibonacci 61.8%1.3515
Daily Pivot Point S11.3489
Daily Pivot Point S21.3472
Daily Pivot Point S31.3452
Daily Pivot Point R11.3526
Daily Pivot Point R21.3546
Daily Pivot Point R31.3564

Author

Akhtar Faruqui

Akhtar Faruqui is a Forex Analyst based in New Delhi, India. With a keen eye for market trends and a passion for dissecting complex financial dynamics, he is dedicated to delivering accurate and insightful Forex news and analysis.

More from Akhtar Faruqui
Share:

Markets move fast. We move first.

Orange Juice Newsletter brings you expert driven insights - not headlines. Every day on your inbox.

By subscribing you agree to our Terms and conditions.

Editor's Picks

EUR/USD rebounds after falling toward 1.1700

EUR/USD gains traction and trades above 1.1730 in the American session, looking to end the week virtually unchanged. The bullish opening in Wall Street makes it difficult for the US Dollar to preserve its recovery momentum and helps the pair rebound heading into the weekend.

GBP/USD steadies below 1.3400 as traders assess BoE policy outlook

Following Thursday's volatile session, GBP/USD moves sideways below 1.3400 on Friday. Investors reassess the Bank of England's policy oıtlook after the MPC decided to cut the interest rate by 25 bps by a slim margin. Meanwhile, the improving risk mood helps the pair hold its ground.

Gold stays below $4,350, looks to post small weekly gains

Gold struggles to gather recovery momentum and stays below $4,350 in the second half of the day on Friday, as the benchmark 10-year US Treasury bond yield edges higher. Nevertheless, the precious metal remains on track to end the week with modest gains as markets gear up for the holiday season.

Crypto Today: Bitcoin, Ethereum, XRP rebound amid bearish market conditions

Bitcoin (BTC) is edging higher, trading above $88,000 at the time of writing on Monday. Altcoins, including Ethereum (ETH) and Ripple (XRP), are following in BTC’s footsteps, experiencing relief rebounds following a volatile week.

How much can one month of soft inflation change the Fed’s mind?

One month of softer inflation data is rarely enough to shift Federal Reserve policy on its own, but in a market highly sensitive to every data point, even a single reading can reshape expectations. November’s inflation report offered a welcome sign of cooling price pressures. 

XRP rebounds amid ETF inflows and declining retail demand demand

XRP rebounds as bulls target a short-term breakout above $2.00 on Friday. XRP ETFs record the highest inflow since December 8, signaling growing institutional appetite.