|

USD/CAD Price Analysis: Consolidating before moving to 1.3270 support confluence

  • USD/CAD holds lower ground at weekly bottom, pressured after two-day downtrend.
  • Clear downside break of key EMA, Fibonacci retracement join looming bear cross on MACD to lure bears.
  • Monthly resistance line, descending trend line from October challenge pair buyers.

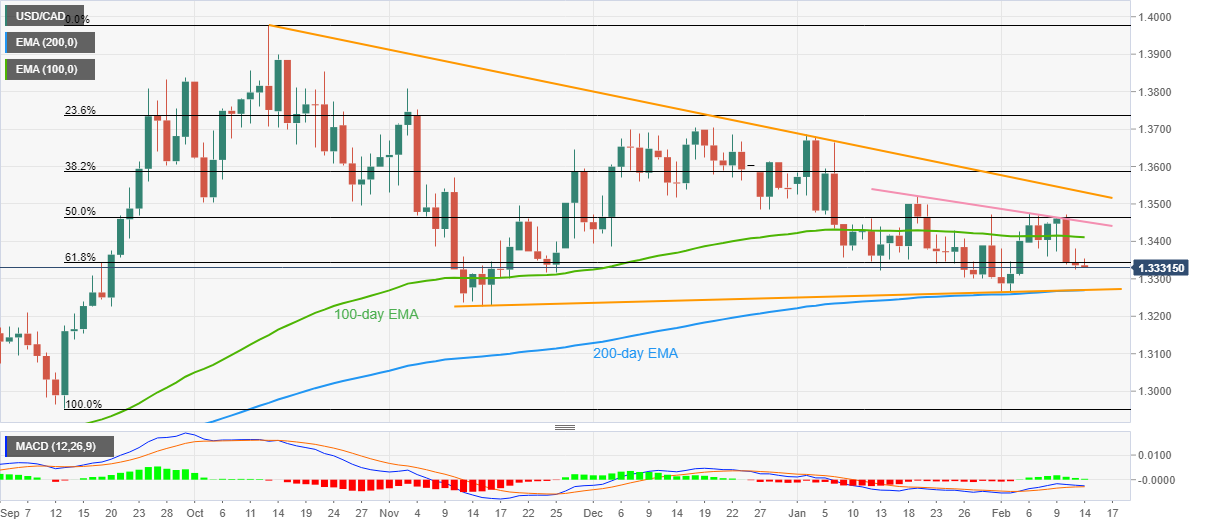
USD/CAD remains depressed around 1.3330 even as bulls and bears jostle during early Tuesday, due to the market’s inaction ahead of the key US inflation data. In doing so, the Loonie pair probes the two-day losing streak at the lowest levels in more than a week.

It’s worth noting that the quote’s sustained downside break of the 100-day Exponential Moving Average (EMA) and the 61.8% Fibonacci retracement level of the September-October upside joins a looming bear cross on the MACD to keep USD/CAD sellers hopeful.

As a result, a convergence of the ascending trend line from mid-November and the 200-day EMA, around 1.3270 by the press time, gains major attention.

Should the pair offers a clear downside break of the 1.3270 key level, the last November’s low near 1.3225 may act as a validation point for the south-run targeting the September 2022 bottom surrounding 1.2955. It should be observed that the 1.3100 and the 1.3000 round figures may act as intermediate halts during the anticipated fall.

Meanwhile, the stated key Fibonacci retracement level, also known as the golden ratio, guards immediate USD/CAD rebound near 1.3345, a break of which highlights the 100-day EMA level of 1.3410.

Following that, a descending resistance line from January 19 and a four-month-old downward-sloping trend line, respectively around 1.3455 and 1.3530, could challenge the USD/CAD bulls.

USD/CAD: Daily chart
Trend: Further downside expected

Additional important levels

Overview
Today last price1.3334
Today Daily Change-0.0002
Today Daily Change %-0.01%
Today daily open1.3336
 
Trends
Daily SMA201.3382
Daily SMA501.3487
Daily SMA1001.3529
Daily SMA2001.3238
 
Levels
Previous Daily High1.338
Previous Daily Low1.3325
Previous Weekly High1.3476
Previous Weekly Low1.3338
Previous Monthly High1.3685
Previous Monthly Low1.33
Daily Fibonacci 38.2%1.3346
Daily Fibonacci 61.8%1.3359
Daily Pivot Point S11.3314
Daily Pivot Point S21.3292
Daily Pivot Point S31.3259
Daily Pivot Point R11.3369
Daily Pivot Point R21.3402
Daily Pivot Point R31.3424

Author

Anil Panchal

Anil Panchal

FXStreet

Anil Panchal has nearly 15 years of experience in tracking financial markets. With a keen interest in macroeconomics, Anil aptly tracks global news/updates and stays well-informed about the global financial moves and their implications.


More from Anil Panchal
Share:

Editor's Picks

GBP/USD advances as US Dollar remains subdued following US inflation data

GBP/USD rises for the second consecutive day, trading around 1.3400 during the Asian hours. The pair appreciates as the US Dollar holds losses following softer-than-expected US inflation data, fueling hopes that the US Federal Reserve might adopt a less hawkish monetary stance.

EUR/USD: Bulls remain cautious below 23.6% Fibo. and 1.1470 hurdle

The EUR/USD pair attracts some dip-buyers following the previous day's pullback from the 1.1460-1.1470 horizontal resistance, though it remains confined within a multi-week-old range. Spot prices trade around the 1.1435-1.1440 region during the Asian session on Wednesday, up for the second straight day amid modest US Dollar weakness.

Gold edges lower as elevated oil prices bolster Fed hike prospects and offset soft USD

Gold attracts some sellers after failing to find acceptance above the $4,100 mark the previous day, though it holds above the $4,000 psychological mark during the Asian session on Wednesday. Despite soft US Consumer Price Index data, investors remain worried about energy-driven inflation as escalating US-Iran tensions and the closure of the Strait of Hormuz remain supportive of elevated crude oil prices.

Bitcoin, Ethereum, and Ripple show tentative recovery as key technical levels hold

Bitcoin, Ethereum and Ripple trade with a mild positive bias on Wednesday as sentiment improves across the cryptocurrency market. BTC is testing its 50-day Exponential Moving Average, ETH has broken above a key resistance level at $1,800, while XRP has found support around a key level.

2% and nothing else: Why Warsh gave Congress three hours of Greenspan

The Federal Reserve Chair who wants the institution to say less spent Tuesday legally required to say more, on the one morning the data handed him something pleasant to say. June's Consumer Price Index fell 0.4% on the month, the steepest single-month decline since April 2020.

Five sessions, one round trip: Why the whipsaw is exactly what Warsh ordered

Markets opened July with a December hike as the base case and spent five trading sessions unlearning and relearning it. A 57K payrolls print bled the tightening bets out of the strip; a re-shut Strait of Hormuz is pushing them back in. Wednesday's minutes from the June FOMC meeting landed mid-round-trip, describing a world that had already stopped existing.















