|

USD/CAD Price Analysis: Consolidates below 1.3600 ahead of US core PCE, Canadian Q4 GDP

  • USD/CAD trades sideways around 1.3570 ahead of the US and Canada economic data.
  • The BoC may shift to rate cuts early if the Canadian Q4 GDP turns out weaker than expectations.
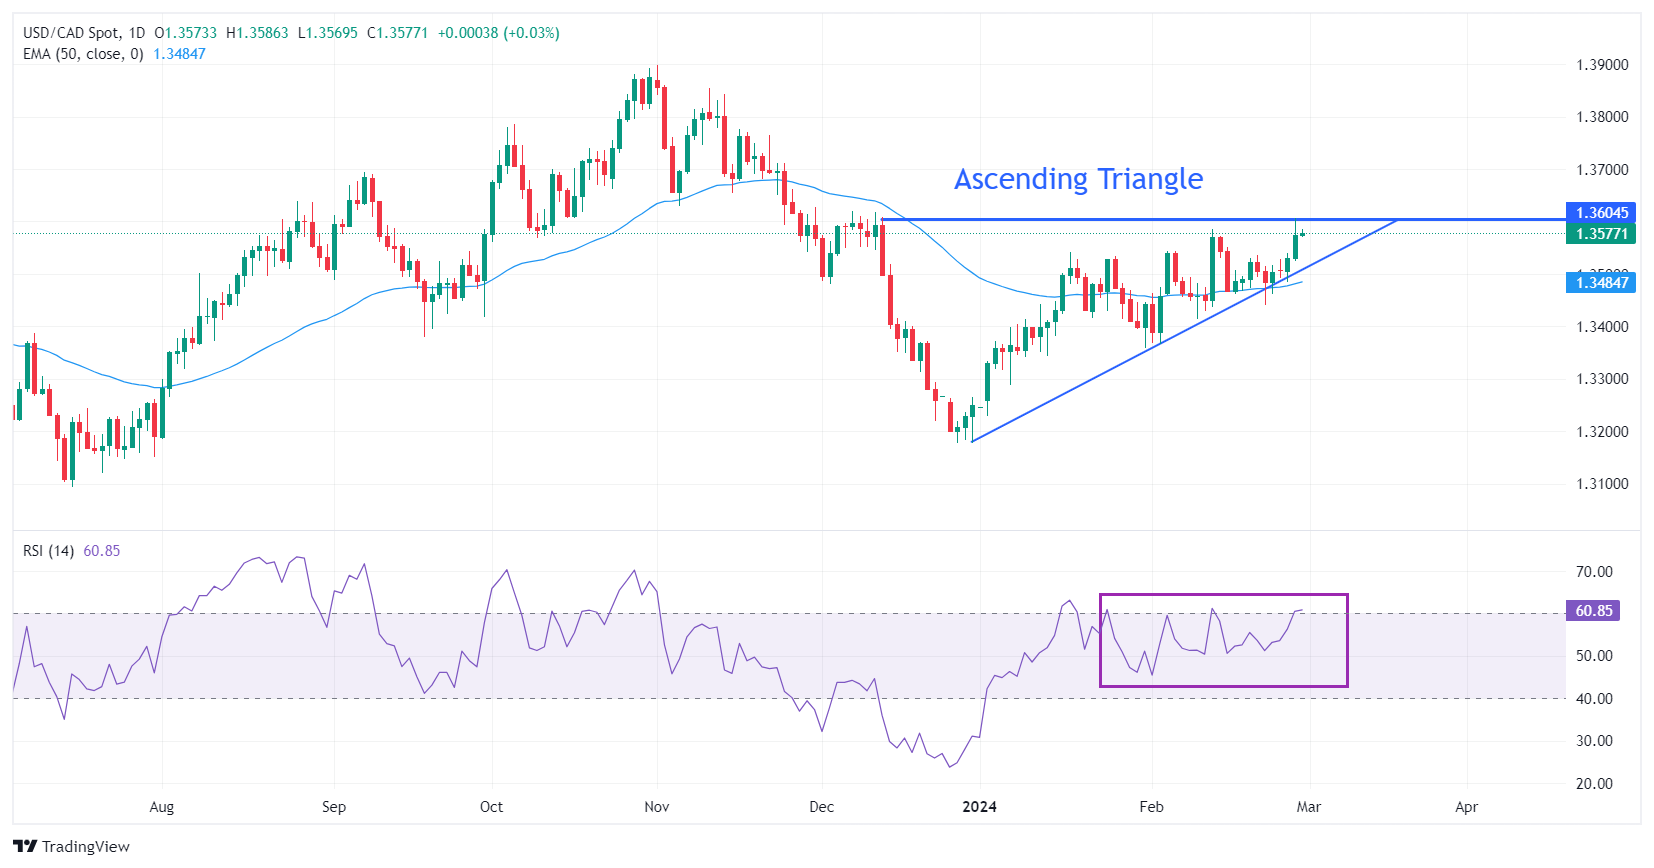
  • The Loonie asset hovers around the horizontal resistance of the Ascending Triangle formation.

The USD/CAD pair is stuck in a tight range around 1.3570 in the European session on Thursday. The Loonie asset awaits the United States core Personal Consumption Expenditure Price Index (PCE) and the Canadian Q4 Gross Domestic Product (GDP) data for fresh guidance, both will be published at 13:30 GMT.

The US Dollar Index turns subdued ahead of the crucial US inflation data. The monthly core PCE Price Index data is anticipated to have grown by 0.4% in January against 0.2% increase in December. The annual underlying inflation data is forecasted to have grown at a slower pace of 2.8% vs. 2.9% growth in December.

On the Canadian Dollar front, the monthly GDP data for December is expected to have grown at a steady pace of 0.2%. The Bank of Canada (BoJ) projected earlier that the growth rate in the last quarter of 2023 will be flat. Weak GDP growth would deepen hopes of early rate cuts by the Bank of Canada (BoC).

USD/CAD aims to deliver a breakout of the Ascending Triangle chart pattern formed on a daily timeframe. The asset hovers around the horizontal resistance of the aforementioned pattern plotted from December 13 high at 1.3608, while the upward-sloping border is placed from December 29 low at 1.3178.

The near-term demand is upbeat as the pair is holding above the 50-day Exponential Moving Average (EMA), which trades around 1.3487.

The 14-period Relative Strength Index (RSI) climbs above 60.00, indicating that momentum leans toward the upside.

Fresh upside would appear if the asset breaks above December 13 high at 1.3608, which will drive the asset towards November 15 low at 1.3655, followed by the round-level resistance of 1.3700.

On the flip side, a downside move below February 22 low at 1.3441 would expose the asset to February 9 low at 1.3413. A breakdown below the latter would extend downside towards January 15 low at 1.3382.

USD/CAD daily chart

USD/CAD

Overview
Today last price1.358
Today Daily Change0.0007
Today Daily Change %0.05
Today daily open1.3573
 
Trends
Daily SMA201.3494
Daily SMA501.3424
Daily SMA1001.3541
Daily SMA2001.3478
 
Levels
Previous Daily High1.3606
Previous Daily Low1.3525
Previous Weekly High1.3536
Previous Weekly Low1.3441
Previous Monthly High1.3542
Previous Monthly Low1.3229
Daily Fibonacci 38.2%1.3575
Daily Fibonacci 61.8%1.3556
Daily Pivot Point S11.353
Daily Pivot Point S21.3486
Daily Pivot Point S31.3448
Daily Pivot Point R11.3612
Daily Pivot Point R21.365
Daily Pivot Point R31.3693


Author

Sagar Dua

Sagar Dua

FXStreet

Sagar Dua is associated with the financial markets from his college days. Along with pursuing post-graduation in Commerce in 2014, he started his markets training with chart analysis.

More from Sagar Dua
Share:

Markets move fast. We move first.

Orange Juice Newsletter brings you expert driven insights - not headlines. Every day on your inbox.

By subscribing you agree to our Terms and conditions.

Editor's Picks

EUR/USD rebounds after falling toward 1.1700

EUR/USD gains traction and trades above 1.1730 in the American session, looking to end the week virtually unchanged. The bullish opening in Wall Street makes it difficult for the US Dollar to preserve its recovery momentum and helps the pair rebound heading into the weekend.

GBP/USD steadies below 1.3400 as traders assess BoE policy outlook

Following Thursday's volatile session, GBP/USD moves sideways below 1.3400 on Friday. Investors reassess the Bank of England's policy oıtlook after the MPC decided to cut the interest rate by 25 bps by a slim margin. Meanwhile, the improving risk mood helps the pair hold its ground.

Gold stays below $4,350, looks to post small weekly gains

Gold struggles to gather recovery momentum and stays below $4,350 in the second half of the day on Friday, as the benchmark 10-year US Treasury bond yield edges higher. Nevertheless, the precious metal remains on track to end the week with modest gains as markets gear up for the holiday season.

Crypto Today: Bitcoin, Ethereum, XRP rebound amid bearish market conditions

Bitcoin (BTC) is edging higher, trading above $88,000 at the time of writing on Monday. Altcoins, including Ethereum (ETH) and Ripple (XRP), are following in BTC’s footsteps, experiencing relief rebounds following a volatile week.

How much can one month of soft inflation change the Fed’s mind?

One month of softer inflation data is rarely enough to shift Federal Reserve policy on its own, but in a market highly sensitive to every data point, even a single reading can reshape expectations. November’s inflation report offered a welcome sign of cooling price pressures. 

XRP rebounds amid ETF inflows and declining retail demand demand

XRP rebounds as bulls target a short-term breakout above $2.00 on Friday. XRP ETFs record the highest inflow since December 8, signaling growing institutional appetite.