USD/CAD Price Analysis: Buyers poke key hurdle to the north around 1.3600


  • USD/CAD struggles to extend three-day uptrend near the highest levels in three weeks.
  • Break of two-month-old horizontal support, bearish MACD signals favor buyers.
  • 50-DMA, seven-week-long descending trend line restrict immediate upside.

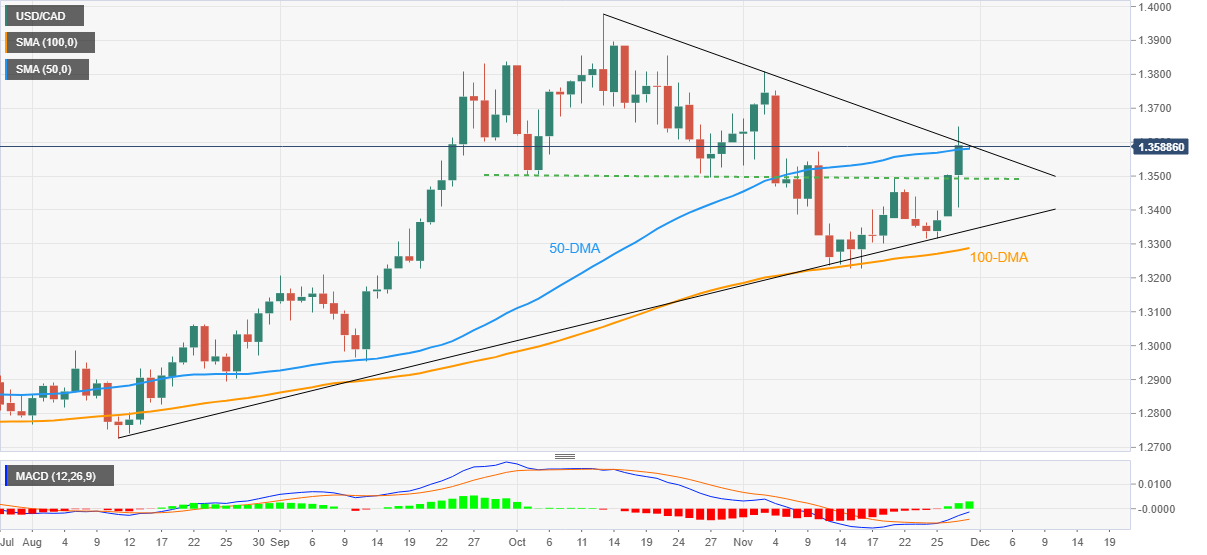
USD/CAD remains sidelined around 1.3585-90, recently picking up bids, as traders struggle with the key hurdle during early Wednesday morning in Asia. In doing so, the Loonie pair probes the three-day uptrend around a multi-day top marked the previous day.

Even so, the USD/CAD pair’s sustained trading beyond the previous key resistances and the 100-DMA joins the bullish MACD signals to keep the buyers hopeful.

That said, a downward-sloping trend line from October 13 and the 50-DMA restrict immediate USD/CAD moves between 1.3600 and 1.3580, a break of which could quickly propel the quote towards the monthly top near 1.3810.

However, multiple hurdles around 1.3840 and 1.3860 could challenge the USD/CAD bulls past 1.3810, which if ignored will highlight the yearly top marked in October surrounding 1.3980.

Alternatively, pullback moves remain elusive unless the quote stays beyond the horizontal support established since early October, near 1.3490 by the press time.

Following that, an upward-sloping trend line from August 11, currently at 1.3340, will precede the 100-DMA support of 1.3287 to challenge the USD/CAD bears.

Overall, USD/CAD is likely to remain firmer but the road to the north appears bumpy.

USD/CAD: Daily chart

Trend: Further upside expected

Additional important levels

Overview
Today last price 1.3592
Today Daily Change 0.0089
Today Daily Change % 0.66%
Today daily open 1.3503
 
Trends
Daily SMA20 1.3432
Daily SMA50 1.3574
Daily SMA100 1.3276
Daily SMA200 1.3015
 
Levels
Previous Daily High 1.3505
Previous Daily Low 1.3381
Previous Weekly High 1.3495
Previous Weekly Low 1.3316
Previous Monthly High 1.3978
Previous Monthly Low 1.3496
Daily Fibonacci 38.2% 1.3458
Daily Fibonacci 61.8% 1.3428
Daily Pivot Point S1 1.3421
Daily Pivot Point S2 1.334
Daily Pivot Point S3 1.3298
Daily Pivot Point R1 1.3545
Daily Pivot Point R2 1.3586
Daily Pivot Point R3 1.3668


Share: Feed news

Information on these pages contains forward-looking statements that involve risks and uncertainties. Markets and instruments profiled on this page are for informational purposes only and should not in any way come across as a recommendation to buy or sell in these assets. You should do your own thorough research before making any investment decisions. FXStreet does not in any way guarantee that this information is free from mistakes, errors, or material misstatements. It also does not guarantee that this information is of a timely nature. Investing in Open Markets involves a great deal of risk, including the loss of all or a portion of your investment, as well as emotional distress. All risks, losses and costs associated with investing, including total loss of principal, are your responsibility. The views and opinions expressed in this article are those of the authors and do not necessarily reflect the official policy or position of FXStreet nor its advertisers. The author will not be held responsible for information that is found at the end of links posted on this page.

If not otherwise explicitly mentioned in the body of the article, at the time of writing, the author has no position in any stock mentioned in this article and no business relationship with any company mentioned. The author has not received compensation for writing this article, other than from FXStreet.

FXStreet and the author do not provide personalized recommendations. The author makes no representations as to the accuracy, completeness, or suitability of this information. FXStreet and the author will not be liable for any errors, omissions or any losses, injuries or damages arising from this information and its display or use. Errors and omissions excepted.

The author and FXStreet are not registered investment advisors and nothing in this article is intended to be investment advice.

Recommended content


Recommended content

Editors’ Picks

AUD/USD failed just ahead of the 200-day SMA

AUD/USD failed just ahead of the 200-day SMA

Finally, AUD/USD managed to break above the 0.6500 barrier on Wednesday, extending the weekly recovery, although its advance faltered just ahead of the 0.6530 region, where the key 200-day SMA sits.

AUD/USD News

EUR/USD met some decent resistance above 1.0700

EUR/USD met some decent resistance above 1.0700

EUR/USD remained unable to gather extra upside traction and surpass the 1.0700 hurdle in a convincing fashion on Wednesday, instead giving away part of the weekly gains against the backdrop of a decent bounce in the Dollar.

EUR/USD News

Gold keeps consolidating ahead of US first-tier figures

Gold keeps consolidating ahead of US first-tier figures

Gold finds it difficult to stage a rebound midweek following Monday's sharp decline but manages to hold above $2,300. The benchmark 10-year US Treasury bond yield stays in the green above 4.6% after US data, not allowing the pair to turn north.

Gold News

Bitcoin price could be primed for correction as bearish activity grows near $66K area

Bitcoin price could be primed for correction as bearish activity grows near $66K area

Bitcoin (BTC) price managed to maintain a northbound trajectory after the April 20 halving, despite bold assertions by analysts that the event would be a “sell the news” situation. However, after four days of strength, the tables could be turning as a dark cloud now hovers above BTC price.

Read more

Bank of Japan's predicament: The BOJ is trapped

Bank of Japan's predicament: The BOJ is trapped

In this special edition of TradeGATEHub Live Trading, we're joined by guest speaker Tavi @TaviCosta, who shares his insights on the Bank of Japan's current predicament, stating, 'The BOJ is Trapped.' 

Read more

Forex MAJORS

Cryptocurrencies

Signatures