|

USD/CAD Price Analysis: Bulls need to make it through 100-day SMA hurdle near 1.3400 mark

  • USD/CAD consolidates in a range around the 50% Fibo. through the Asian session on Monday.
  • The fundamental backdrop favours bullish traders and supports prospects for additional gains.
  • A sustained break below the 1.3225 area is needed to negate the near-term positive outlook.

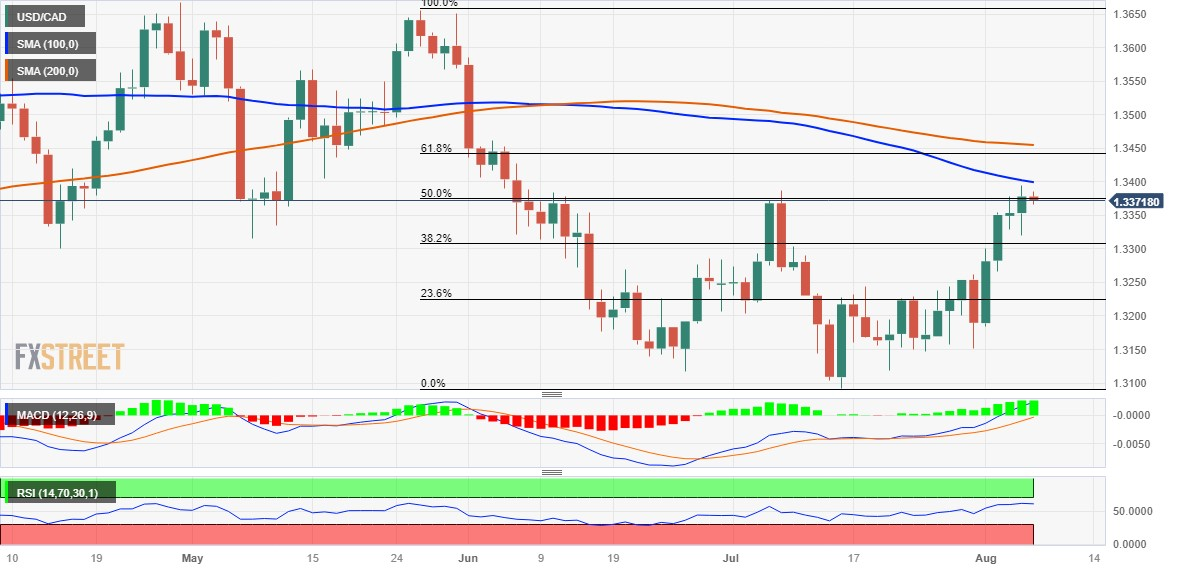
The USD/CAD pair kicks off the new week on a subdued note and oscillates in a narrow band around the 1.3370 area through the Asian session. Spot prices remain below a two-month peak touched on Friday and currently trade around the 50% Fibonacci retracement level of the May-July downfall.

Despite signs that demand for workers in the US was slowing, solid wage growth and a downtick in the unemployment rate pointed to continued tightness in the labour market. This should allow the Federal Reserve (Fed) will keep rates higher for longer and assists the USD to attract some dip-buying on Monday. The Canadian Dollar (CAD), on the other hand, is weighed down by the disappointing release of the domestic jobs report. Furthermore, Crude Oil prices ease from a fresh multi-month top and undermine the commodity-linked Loonie, which, in turn, acts as a tailwind for the USD/CAD pair.

The fundamental backdrop suggests that the path of least resistance for spot prices is to the upside, though bulls might still wait for sustained strength and acceptance beyond the 1.3400 mark, or the 100-day Simple Moving Average (SMA) before placing fresh bets. The USD/CAD pair might then climb to the 1.3445-1.3450 confluence hurdle, comprising the very important 200-day SMA and the 61.8% Fibo. level. The latter should act as a pivotal point, which if cleared will mark a fresh breakout and set the stage for an extension of the recent recovery from sub-1.3100 levels, or the YTD low touched in July.

On the flip side, the 1.3350 area now seems to protect the immediate downside ahead of the 38.2% Fibo. level, around the 1.3300 mark. The subsequent downfall is more likely to attract fresh buying near the 1.3250 horizontal support and remain limited near the 1.3225 region, or the 23.6% Fibo. level. That said, some follow-through selling will negate any near-term positive outlook and make the USD/CAD pair vulnerable to weakening below the 1.3200 mark. Spot prices might then accelerate the fall to the 1.3160-1.3150 intermediate support before eventually dropping to challenge the 1.3100 mark.

USD/CAD daily chart

fxsoriginal

Key levels to watch

USD/CAD

Overview
Today last price1.3372
Today Daily Change-0.0006
Today Daily Change %-0.04
Today daily open1.3378
 
Trends
Daily SMA201.3227
Daily SMA501.3279
Daily SMA1001.3402
Daily SMA2001.3456
 
Levels
Previous Daily High1.3394
Previous Daily Low1.332
Previous Weekly High1.3394
Previous Weekly Low1.3151
Previous Monthly High1.3387
Previous Monthly Low1.3093
Daily Fibonacci 38.2%1.3366
Daily Fibonacci 61.8%1.3348
Daily Pivot Point S11.3334
Daily Pivot Point S21.3289
Daily Pivot Point S31.3259
Daily Pivot Point R11.3408
Daily Pivot Point R21.3439
Daily Pivot Point R31.3483

Author

Haresh Menghani

Haresh Menghani is a detail-oriented professional with 10+ years of extensive experience in analysing the global financial markets.

More from Haresh Menghani
Share:

Editor's Picks

GBP/USD surges to multi-day peaks past 1.3250

GBP/USD leaves behind Friday’s small pullback and advances past 1.3250 level, or five-day highs, on Monday. Cable’s upside follows extra losses in the Greenback, while traders continue to assess the geopolitical front and upcoming key events.

EUR/USD pops to daily highs near 1.1430

EUR/USD starts the week on a positive note, climbing to as high as the 1.1430 zone, or daily tops, on Monday. The pair’s recovery comes in response to the broad-based US Dollar weakness, while investors continue to monitor developments from the Middle East ahead of the beginning of the ECB's annual forum.

Gold remains supported by $4,000

Gold remains under marked selling pressure, holding on just above the key $4,000 mark per troy ounce at the beginning of the week. The precious metal reverses two daily advances in a row as renewed effervescence in the Middle East revive inflation concerns and bolster Fed rate hike expectations.

Bitcoin four-year cycle: BTC risks 75% drawdown with four months of bear market still ahead

Bitcoin price continues to trend downward below the $60,000 support zone after losing over 50% of its value since the $126,199 high in October. Bitcoin’s four-year cycle, measured from cycle tops to bottoms, suggests that four months of a bear market are still ahead.

Just like Fed, is BoJ’s independence under threat?

When talking about central bank independence, most of the focus has been on Donald Trump’s pressure on the Federal Reserve. But a similar story, a quieter one for now, seems to be happening on the other side of the Pacific: Japan’s government may be testing the Bank of Japan’s independence.

Kevin Warsh isn't expected to say much in Sintra: That's exactly why markets will listen

Financial markets could find an important catalyst in the enchanting, fairytale-like landscape of Sintra this week. The ECB Forum will, as it does every year, gather the crème de la crème of central banks. The new boss at the Fed, who has clearly said that the Fed should stop explaining everything, will need to talk – and traders should listen.