|

USD/CAD Price Analysis: Bulls moving in for the kill, 38.2% Fibo 1.2550 eyed

  • USD/CAD bulls are stepping in at a demand area on the daily chart.
  • The lower time frames offer structural targets at 1.2550 and 1.2580.

USD/CAD, following a break of the head and shoulders neckline as per prior analysisUSD/CAD Price Analysis: Bears to target 1.2480 on a breakout below daily H&S neckline, has started to stall in the decline. 

While there is still every possibility that it can continue lower, a deeper correction could be on the cards as follows:

USD/CAD daily chart

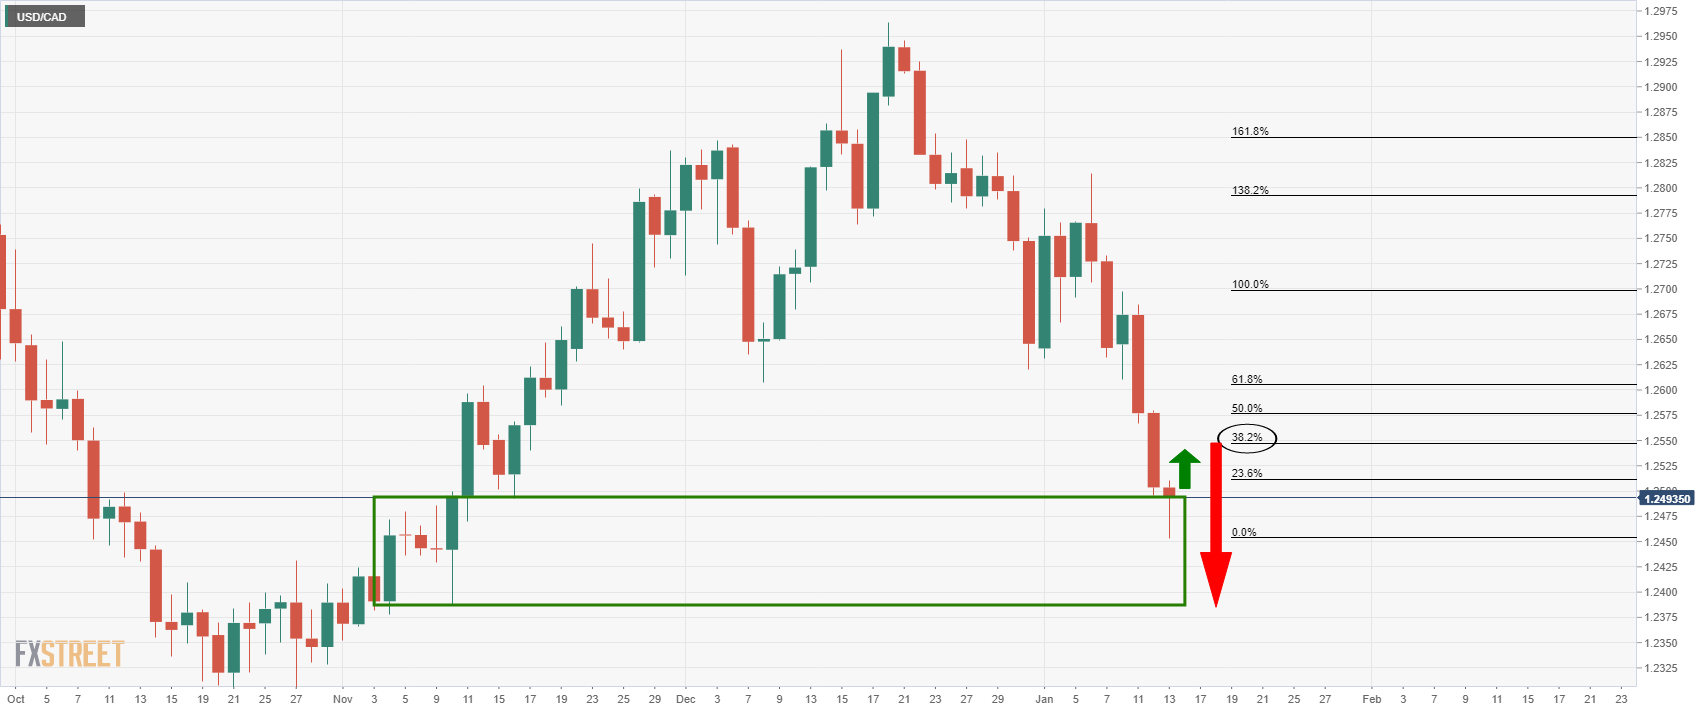
The daily chart shows that the price has run into an area of demand and has stalled. This exposes the 38.2% Fibonacci retracement level near 1.2550 for the forthcoming sessions. 

USD/CAD H4 chart

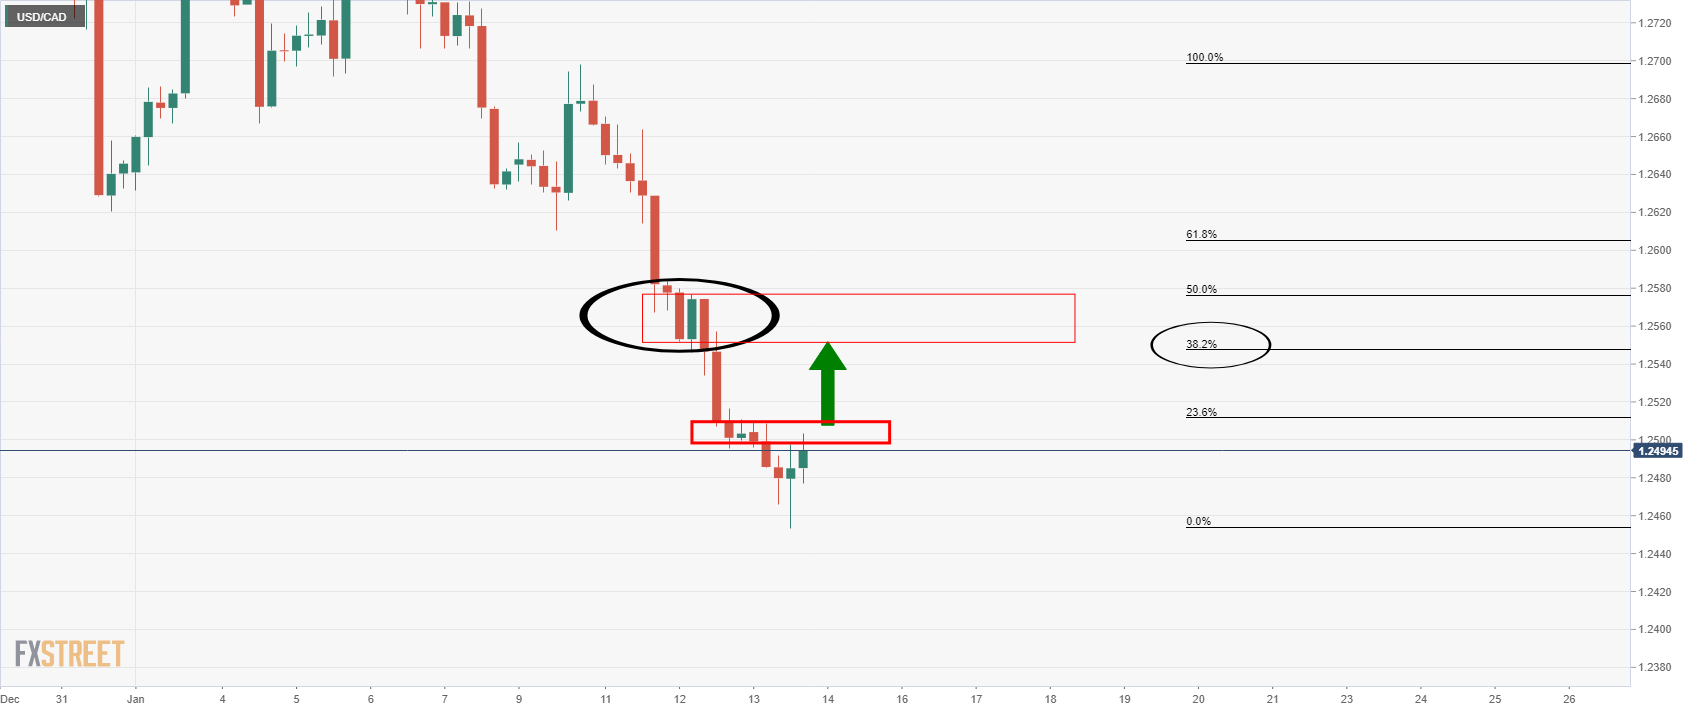
When moving down to the 4-hour time frame, we see that there was some demand in this area during the bearish run. In turn, we can expect the price to be drawn to this liquidity pool should the bulls manage to break the first layer of resistance around 1.25 the figure. 

USD/CAD H1 chart

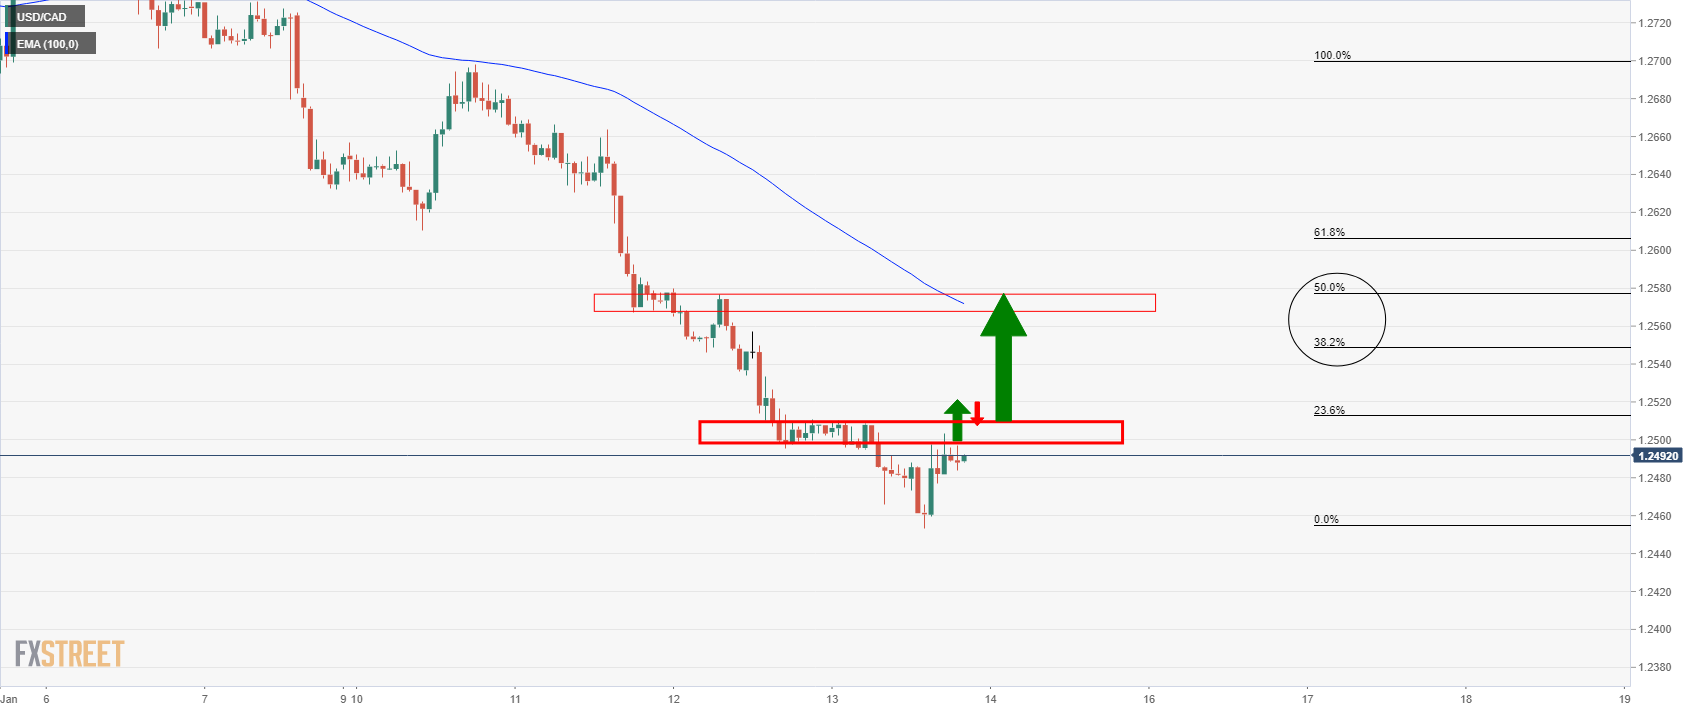
On the hourly time frame, the daily 50% mean reversion level comes in near hourly structure higher up around 1.2580 that currently has a confluence of the 100-hour EMA. If the bulls manage to clear 1.2550 and stay in control, this could be the next level of interest. 

Author

Ross J Burland

Ross J Burland, born in England, UK, is a sportsman at heart. He played Rugby and Judo for his county, Kent and the South East of England Rugby team.

More from Ross J Burland
Share:

Editor's Picks

EUR/USD eyes nine-day EMA barrier after rebounding from 1.1600

EUR/USD gains ground after registering modest losses in the previous session, trading around 1.1620 during the Asian hours on Friday. The technical analysis of the daily chart suggests an ongoing bearish bias as the pair remains within the descending channel pattern.

GBP/USD: Pound Sterling ticks up against US Dollar in countdown to US NFP

The Pound Sterling trades marginally higher to near 1.3365 against the US Dollar during the Asian trading session on Friday. The GBP/USD pair edges up as the US Dollar ticks down ahead of the United States Nonfarm Payrolls data for February, which will be published at 13:30 GMT.

Gold awaits US Nonfarm Payrolls for a clear directional impetus

Gold rebounds above $5,100 early Friday after testing the $5,050 level amid global sell-off. The US Dollar pulls back as profit-taking creeps in ahead of US labor data. For February. 21-day SMA holds amid bullish RSI; a daily closing above 61.8% Fibo is critical for Gold buyers.

Top Crypto Gainers: Lombard, Humanity Protocol, OKB rally on US Fed’s tokenized securities clarity, NYSE investment

Lombard, Humanity Protocol, and OKB rally over the last 24 hours, securing the top-gainer spots in the early Asian session. The US Federal Reserve issued clarity on tokenized securities, which expands its utility and reduces regulatory friction with US banks, driving the Real-World Assets tokenization crypto projects. 

The market compass is pointing at a barrel of Oil

The Asian open is arriving with equities leaning the wrong way, and the reason is not complicated. The market’s compass needle has snapped firmly toward crude. In this tape, oil is not just another input price; it is the gravitational center around which every asset class is orbiting.

Ripple tests recovery strength amid steady ETF inflows, growing retail interest

Ripple (XRP) continues to demonstrate notable resilience as the cryptocurrency market navigates the persistent war in the Middle East after the United States (US) and Israel attacked Iran on Saturday.