|

USD/CAD Price Analysis: Bulls brace for 1.2660 key hurdle

  • USD/CAD grinds higher following the run-up to refresh seven-week top.
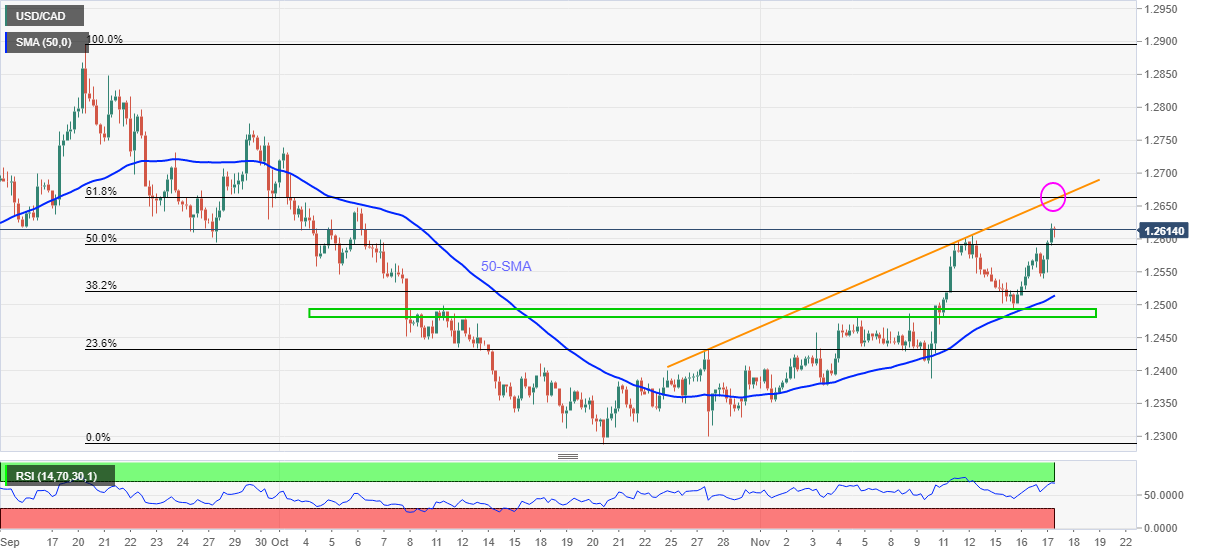
  • Short-term ascending trend line, 61.8% Fibonacci retracement tests immediate upside, overbought RSI conditions.
  • 50-SMA restricts immediate downside, late September peak lures bulls past 1.2660.

USD/CAD picks up bids in a 20-pip trading range above 1.2600 after rising to the highest levels since early October the previous day. That said, the quote rises to 1.2613 amid the initial Asian session on Thursday.

Sustained trading beyond the 50-SMA and a six-week-old horizontal area keeps USD/CAD buyers hopeful. However, a convergence of an ascending trend line from October 27 and 61.8% Fibonacci retracement (Fibo.) of September-October fall, challenge the bulls around 1.2660 amid the overbought RSI conditions.

Hence, the pair buyers should wait for a clear upside break of 1.2660 for fresh entry. Following that, the 1.2700 threshold and late September high near 1.2775 will be in focus.

Even if the USD/CAD upside remains intact past 1.2775, September’s top around the 1.2900 threshold should attract the sellers.

Alternatively, pullback moves may aim for the 50% retracement level of 1.2592 before targeting the 50-SMA, around 1.2515 at the latest.

However, USD/CAD should watch for entry if the quote breaks a horizontal region comprising multiple levels since October 8, around 1.2480-95.

USD/CAD: Four-hour chart

Trend: Pullback expected

Additional important level

Overview
Today last price1.2613
Today Daily Change0.0048
Today Daily Change %0.38%
Today daily open1.2565
 
Trends
Daily SMA201.243
Daily SMA501.2537
Daily SMA1001.2547
Daily SMA2001.2472
 
Levels
Previous Daily High1.2568
Previous Daily Low1.2493
Previous Weekly High1.2605
Previous Weekly Low1.2387
Previous Monthly High1.2739
Previous Monthly Low1.2288
Daily Fibonacci 38.2%1.254
Daily Fibonacci 61.8%1.2522
Daily Pivot Point S11.2516
Daily Pivot Point S21.2466
Daily Pivot Point S31.244
Daily Pivot Point R11.2592
Daily Pivot Point R21.2618
Daily Pivot Point R31.2667

Author

Anil Panchal

Anil Panchal

FXStreet

Anil Panchal has nearly 15 years of experience in tracking financial markets. With a keen interest in macroeconomics, Anil aptly tracks global news/updates and stays well-informed about the global financial moves and their implications.

More from Anil Panchal
Share:

Markets move fast. We move first.

Orange Juice Newsletter brings you expert driven insights - not headlines. Every day on your inbox.

By subscribing you agree to our Terms and conditions.

Editor's Picks

EUR/USD eyes 1.1800 barrier near two-month highs

EUR/USD extends its gains for the second consecutive day on Tuesday and approaches 1.1800. On the daily chart, technical analysis indicates a persistent bullish bias, as the pair moves upward within the ascending channel pattern. Additionally, the 14-day Relative Strength Index at 68.89 reaffirms the bullish bias.

GBP/USD climbs to 1.3500 area, renews ten-week high

GBP/USD extends its weekly rally and trades at its highest level since early October near 1.3500. The US Dollar remains under persistent bearish pressure heading into the holidays, while Pound traders largely brush off the latest interest rate cut from the Bank of England.

Gold approaches $4,500 as record-setting rally continues

Gold builds on Monday's impressive gains and advances toward $4,500, setting fresh record-highs along the way. Heightened geopolitical tensions, combined with the broad-based US Dollar (USD) weakness ahead of the Q3 GDP data, help XAU/USD preserve its bullish momentum.

US GDP expected to highlight steady growth in Q3

The United States Bureau of Economic Analysis (BEA) will publish the first preliminary estimate of the third-quarter Gross Domestic Product on Tuesday, at 13:30 GMT. Analysts expect the data to show annualized growth of 3.2%, following the 3.8% expansion in the previous quarter.

Ten questions that matter going into 2026

2026 may be less about a neat “base case” and more about a regime shift—the market can reprice what matters most (growth, inflation, fiscal, geopolitics, concentration). The biggest trap is false comfort: the same trades can look defensive… right up until they become crowded.

XRP steadies above $1.90 support as fund inflows and retail demand rise

Ripple (XRP) is stable above support at $1.90 at the time of writing on Monday, after several attempts to break above the $2.00 hurdle failed to materialize last week. Meanwhile, institutional interest in the cross-border remittance token has remained steady.