USD/CAD Price Analysis: Bears are holding the fort at key daily confluence area
- USD/CA bears are on the verge of a move.
- The daily chart's M-formation is a compelling feature on the charts.

USD/CAD is on the verge of a move lower according to the daily market structure and so long as the recent highs continue to hold. The following illustrates the bearish bias from both a daily and hourly perspective.
USD/CAD daily chart
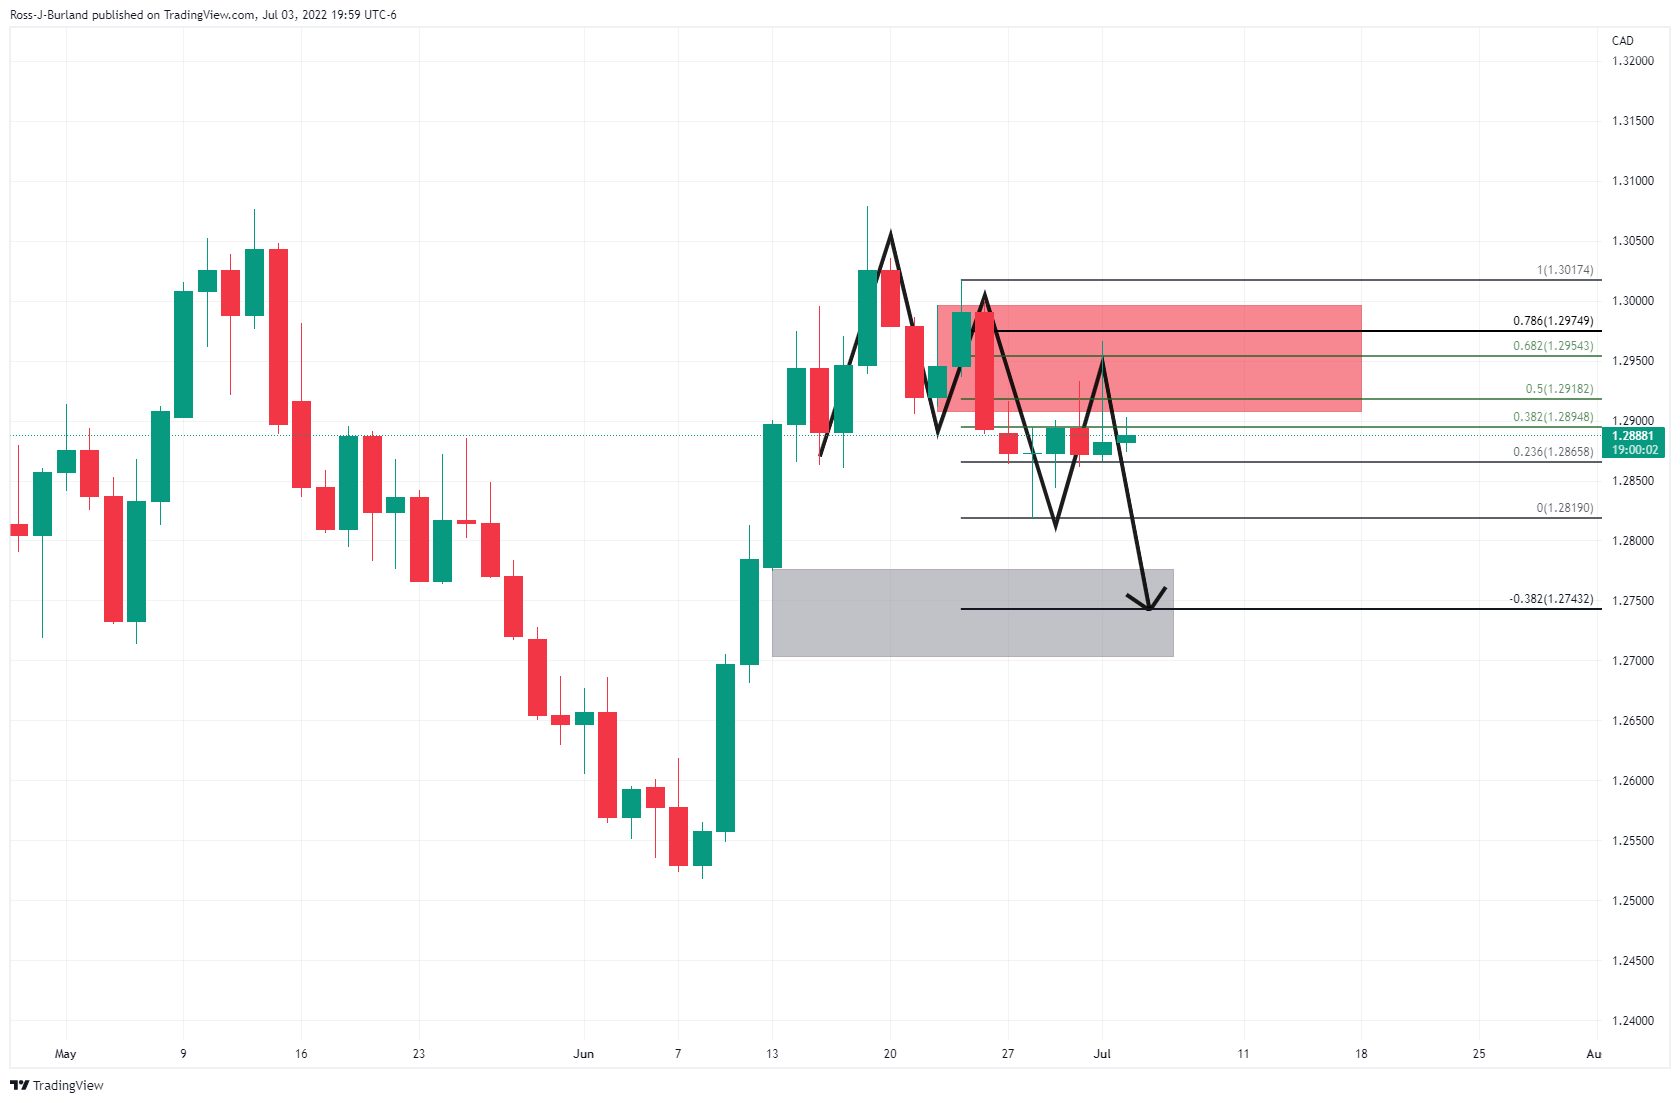
The price has been testing the daily M-formation's neckline with a rejection near a 61.8% Fibonacci level which puts the bias into the hands of the bears to start the week. There is an area of imbalance to the downside that cold be mitigated in the forth coming days.
USD/CAD H1 chart
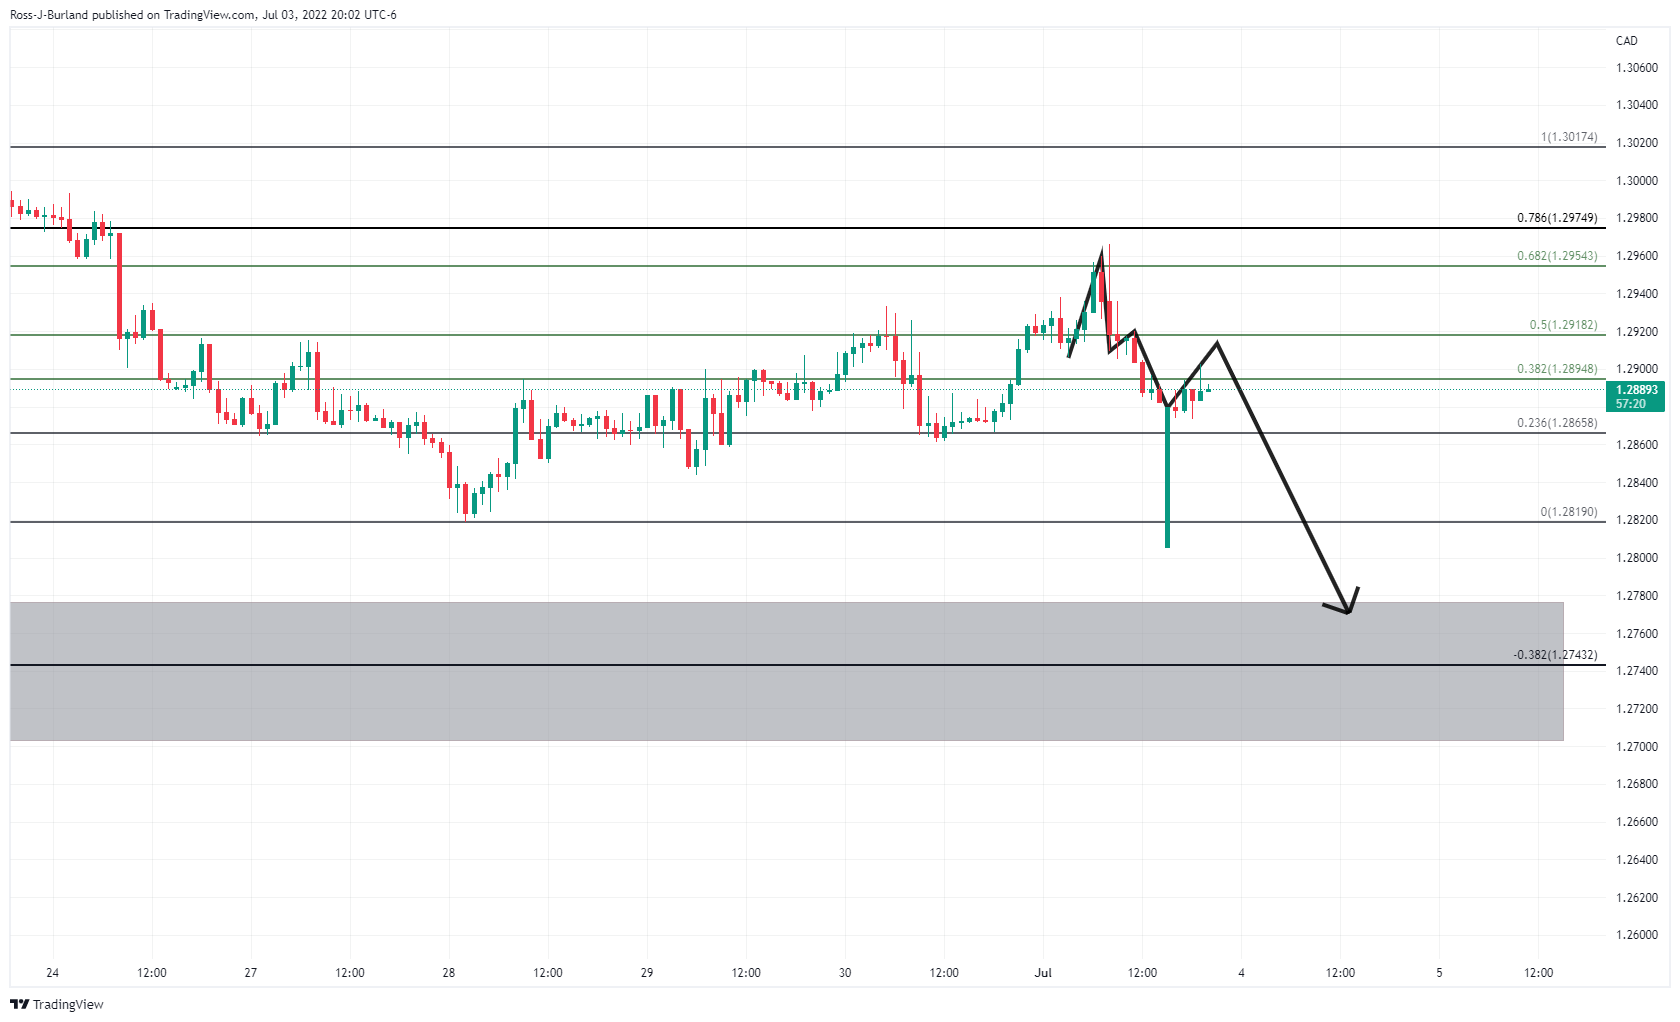
There is a bearish schematic playing out on the hourly chart with the M-formation's neckline vulnerable but resistance would be expected around there which could lead to a melt towards the daily imbalance as illustrated.
Author

Ross J Burland
FXStreet
Ross J Burland, born in England, UK, is a sportsman at heart. He played Rugby and Judo for his county, Kent and the South East of England Rugby team.


