- The USD/CAD grinds higher after five days in the red.
- Fed’s Chair Powell approves 50 bps rate hikes and could happen not just once.
- USD/CAD Price Forecast: Broke the 200-DMA, exposing the USD/CAD to further downward pressure, with 1.2500 as the next target.
The USD/CAD snaps five days of consecutive losses amid a risk-on market mood. At the same time, oil prices ease from around $115.00, thus weighing on the Loonie, as the greenback reflects recent hawkishness from Federal Reserve policymakers, led by Fed’s Chair Powell saying that a 50 bps increase is on the cards, aligned with Fed hawks Bullard, Bostic, Waller, and Barkin. At the time of writing, the USD/CAD is trading at 1.2611.
Fed’s hawkishness and higher US Treasury yields keep the US dollar strong
Meanwhile, European and US equities keep trading in the green, while the DXY retraced from daily highs near the 99.00 mark around 98.481, up some 0.01%. Meanwhile, US Treasury yields are surging, in the day, as market players begin to price in hikes of the US central bank. Worth noting that the yield in 5s at 2.380% is higher than the 10-year T-note yield at 2.368%, something that USD/CAD traders need to be aware of.
The US economic docket featured more Fed speaking. St. Louis Fed’s James Bullard said that the Fed needs to get policy-neutral, saying that “faster is better” and reiterated that 50 basis points increases would be in the mix.
The Canadian economic docket featured the Producer Price Index for February monthly, which rose 3.1%, higher than January’s 2.5%, while the Raw Materials Prices increased by 29.8%, but lower than the previous reading at 30.5%.
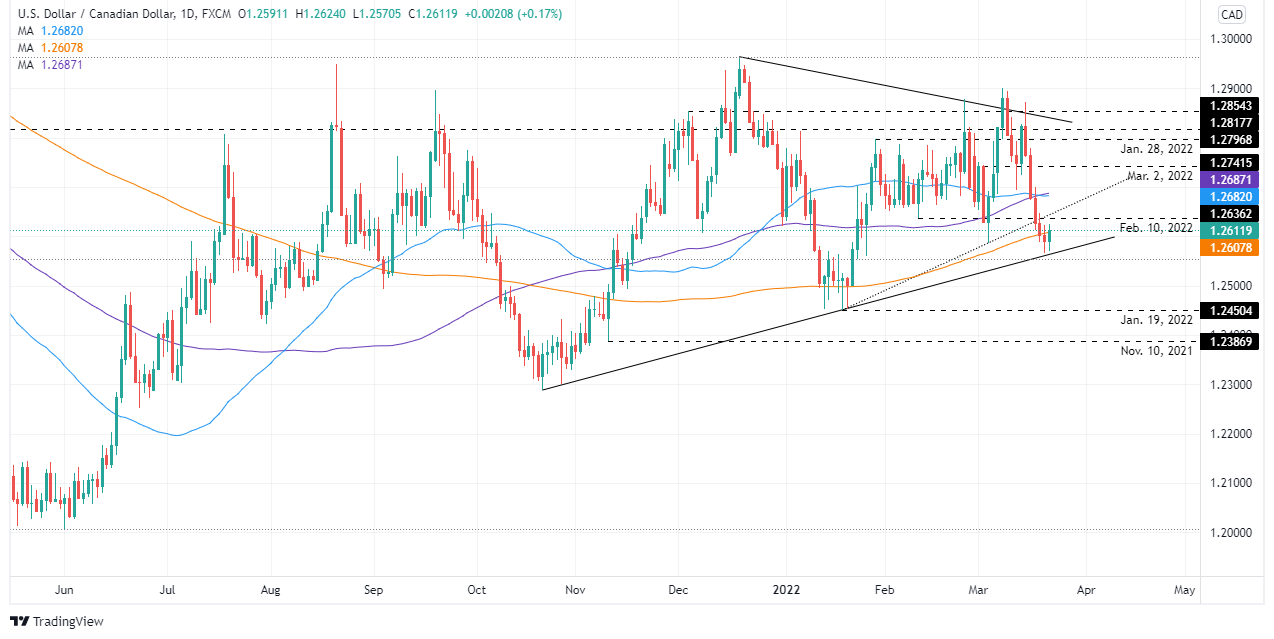
USD/CAD Price Forecast: Technical outlook
The USD/CAD just crossed below the 200-day moving average (DMA) at 1.2607, additionally to the 50-DMA crossing under the 100-DMA, each located at 1.2681 and 1.2687, respectively. Also, on March 18, the USD/CAD broke an upslope trendline, drawn from late January, support which once broken exposed the abovementioned 200-DMA.
With that said, the USD/CAD bias is neutral-downwards. The first support would be a six-month-old upslope trendline around 1.2560-75. Breach of the latter could pave the way for further downside, with the January 19 daily low at 1.2450, followed by November 10, 2021, cycle low at 1.2387.
Upwards, the first resistance would be the 200-DMA at 1.2607. Once cleared, the next resistance would be 1.2650, followed by the confluence of the 50 and 100-DMA around 1.2681-87.
Information on these pages contains forward-looking statements that involve risks and uncertainties. Markets and instruments profiled on this page are for informational purposes only and should not in any way come across as a recommendation to buy or sell in these assets. You should do your own thorough research before making any investment decisions. FXStreet does not in any way guarantee that this information is free from mistakes, errors, or material misstatements. It also does not guarantee that this information is of a timely nature. Investing in Open Markets involves a great deal of risk, including the loss of all or a portion of your investment, as well as emotional distress. All risks, losses and costs associated with investing, including total loss of principal, are your responsibility. The views and opinions expressed in this article are those of the authors and do not necessarily reflect the official policy or position of FXStreet nor its advertisers. The author will not be held responsible for information that is found at the end of links posted on this page.
If not otherwise explicitly mentioned in the body of the article, at the time of writing, the author has no position in any stock mentioned in this article and no business relationship with any company mentioned. The author has not received compensation for writing this article, other than from FXStreet.
FXStreet and the author do not provide personalized recommendations. The author makes no representations as to the accuracy, completeness, or suitability of this information. FXStreet and the author will not be liable for any errors, omissions or any losses, injuries or damages arising from this information and its display or use. Errors and omissions excepted.
The author and FXStreet are not registered investment advisors and nothing in this article is intended to be investment advice.
Recommended content
Editors’ Picks
EUR/USD extends gains above 1.0700, focus on key US data
EUR/USD meets fresh demand and rises toward 1.0750 in the European session on Thursday. Renewed US Dollar weakness offsets the risk-off market environment, supporting the pair ahead of the key US GDP and PCE inflation data.
USD/JPY keeps pushing higher, eyes 156.00 ahead of US GDP data
USD/JPY keeps breaking into its highest chart territory since June of 1990 early Thursday, recapturing 155.50 for the first time in 34 years as the Japanese Yen remains vulnerable, despite looming intervention risks. The focus shifts to Thursday's US GDP report and the BoJ decision on Friday.
Gold closes below key $2,318 support, US GDP holds the key
Gold price is breathing a sigh of relief early Thursday after testing offers near $2,315 once again. Broad risk-aversion seems to be helping Gold find a floor, as traders refrain from placing any fresh directional bets on the bright metal ahead of the preliminary reading of the US first-quarter GDP due later on Thursday.
Injective price weakness persists despite over 5.9 million INJ tokens burned
Injective price is trading with a bearish bias, stuck in the lower section of the market range. The bearish outlook abounds despite the network's deflationary efforts to pump the price.
US Q1 GDP Preview: Economic growth set to remain firm in, albeit easing from Q4
The United States Gross Domestic Product (GDP) is seen expanding at an annualized rate of 2.5% in Q1. The current resilience of the US economy bolsters the case for a soft landing.