US Dollar rally stalls with Trump securing last swing state
- The US Dollar broadly in the green and across the board on Monday.
- The main focus for traders is on the US inflation data for October later this week.
- The US Dollar index pops above 105.00 and is ready to test resistance levels.

The US Dollar (USD) starts the week on the front foot and strengthens on Monday, with the US Dollar Index (DXY) edging higher and ticking 105.70 on the topside. The positive undertone for the Greenback is supported by the increasing likelihood that the Republican Party will win a majority in the US Congress after President-elect Donald Trump has already won the presidency and the Republicans secured a majority in the US Senate. The vote count for the House of Representatives is still ongoing, with only four more seats needed for the Republicans to win it.
The US economic calendar is empty on Monday in observance of Veteran's Day. Stock markets in the US will remain open, but bond markets will be closed.
Later in the week, investors will pay close attention to speeches from several Federal Reserve (Fed) officials, including Fed Chair Jerome Powell, and the US Consumer Price Index (CPI) data for October, which will be published on Wednesday.
Daily digest market movers: GDP and CPI later this week
- Due to the Veterans’ Day bank holiday, expect low volatility and volumes as US bond markets remain closed on Monday.
- All equities are off to a good start this week. European equities are surging over 1%, while US equities are in the green. Only exception is the Nasdaq which is flat ot marginally in the red.
- The CME FedWatch Tool is pricing in another 25 basis points (bps) rate cut by the Fed at the December 18 meeting by 68.5%. A smaller 31.5% chance is for rates to remain unchanged.
- The US 10-year benchmark rate trades at 4.30%, and the bond market remains closed on Monday.
US Dollar Index Technical Analysis: Risk of firm rejection for the rest of the week
The US Dollar Index (DXY) pushes higher on Monday after headlines over the weekend that President-elect Trump has won the last remaining swing state in the US election and has secured a substantial landslide victory. Should the House of Representatives, where counting is still ongoing, fall in the hands of the Republicans, expect another push higher in the DXY once the headline breaks and is confirmed by several media outlets.
The first level to watch out for on the upside is 105.53 (April 11 high), a very firm cap resistance, with 105.89 (May 2 high) just above. Once that level is broken, 106.52, the high of April and a double top, will be the last level standing before starting to talk about 107.00.
On the downside, the round level of 104.00 and the 200-day Simple Moving Average (SMA) at 103.86 should refrain from sending the DXY any lower.
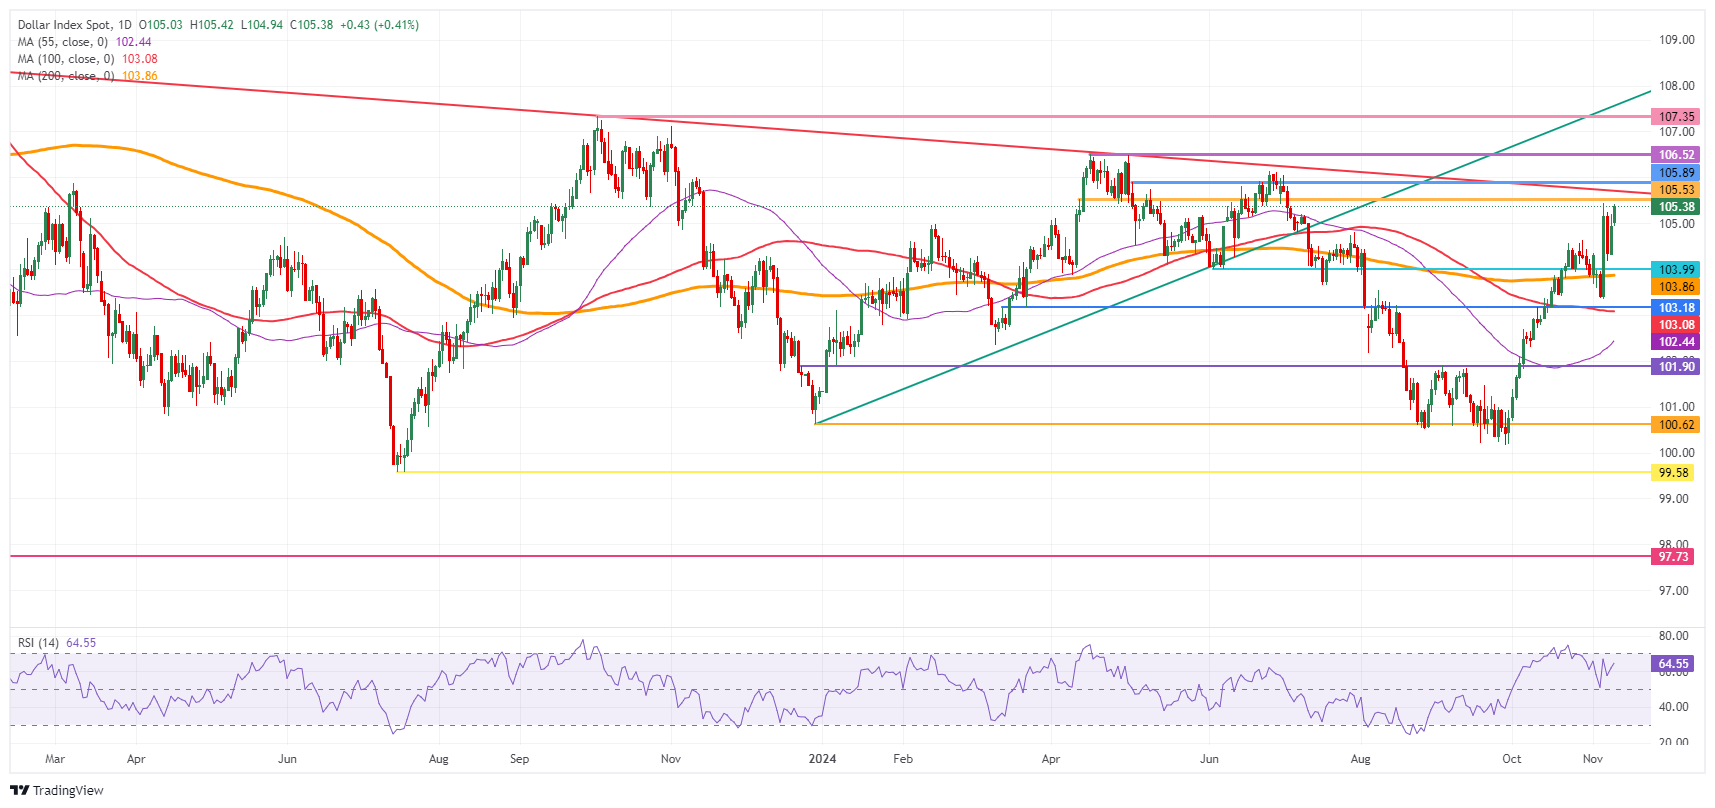
US Dollar Index: Daily Chart
GDP FAQs
A country’s Gross Domestic Product (GDP) measures the rate of growth of its economy over a given period of time, usually a quarter. The most reliable figures are those that compare GDP to the previous quarter e.g Q2 of 2023 vs Q1 of 2023, or to the same period in the previous year, e.g Q2 of 2023 vs Q2 of 2022. Annualized quarterly GDP figures extrapolate the growth rate of the quarter as if it were constant for the rest of the year. These can be misleading, however, if temporary shocks impact growth in one quarter but are unlikely to last all year – such as happened in the first quarter of 2020 at the outbreak of the covid pandemic, when growth plummeted.
A higher GDP result is generally positive for a nation’s currency as it reflects a growing economy, which is more likely to produce goods and services that can be exported, as well as attracting higher foreign investment. By the same token, when GDP falls it is usually negative for the currency. When an economy grows people tend to spend more, which leads to inflation. The country’s central bank then has to put up interest rates to combat the inflation with the side effect of attracting more capital inflows from global investors, thus helping the local currency appreciate.
When an economy grows and GDP is rising, people tend to spend more which leads to inflation. The country’s central bank then has to put up interest rates to combat the inflation. Higher interest rates are negative for Gold because they increase the opportunity-cost of holding Gold versus placing the money in a cash deposit account. Therefore, a higher GDP growth rate is usually a bearish factor for Gold price.
Author

Filip Lagaart
FXStreet
Filip Lagaart is a former sales/trader with over 15 years of financial markets expertise under its belt.


