|

US Dollar Index Technical Analysis: Rising wedge can send DXY down to 97.00 figure

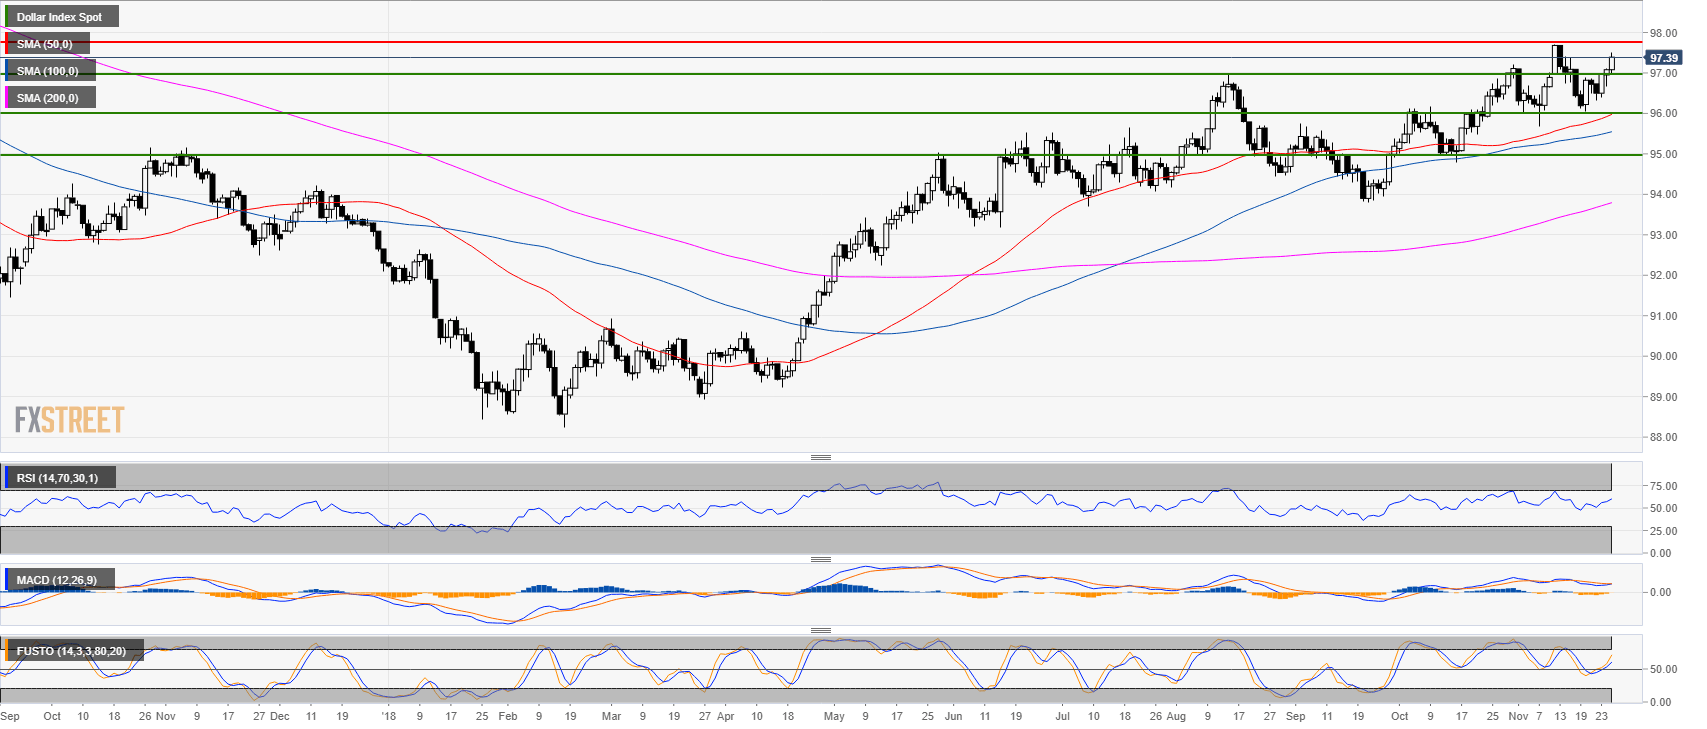
US Dollar Index (DXY) daily chart

  • DXY is trading in a bull trend above the 50, 100 and 200-day simple moving averages (SMAs).
  • DXY broke above the 97.00 figure as bulls are targeting the 2018 high. 
  • The RSI, MACD and Stochastic indicators are bullishly configured. 
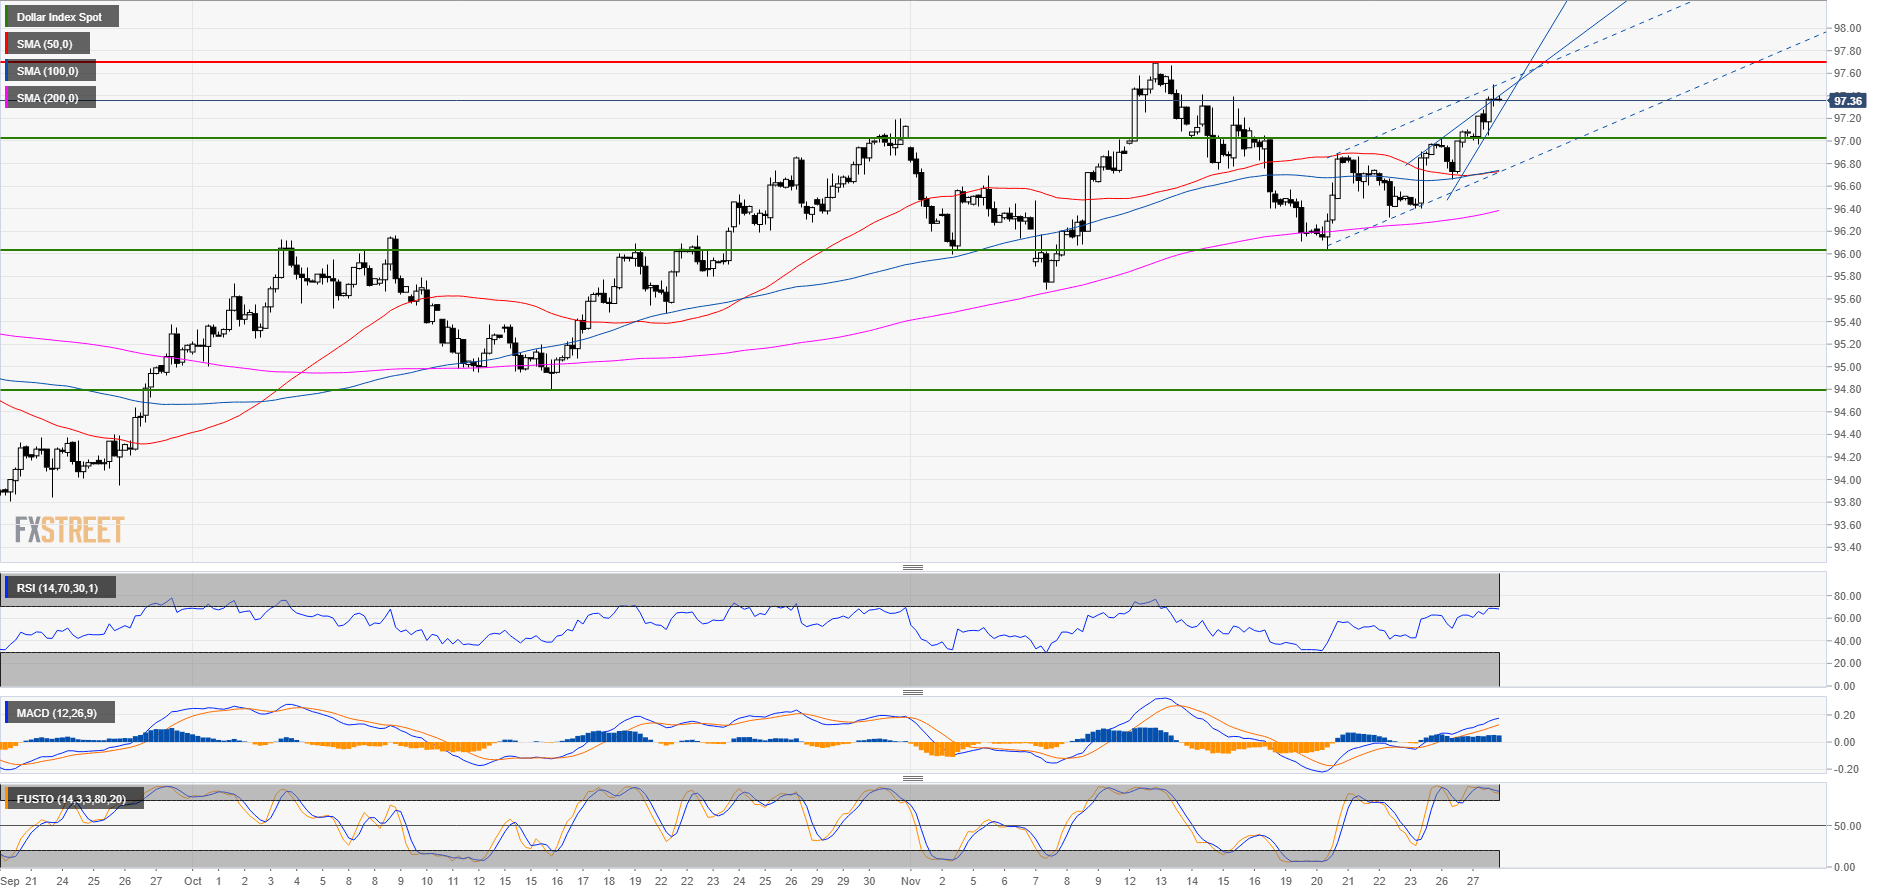
DXY 4-hour chart

  • DXY is a the top of a bullish channel while the market formed a rising wedge. While a spike to 97.70 (2018 high) can still potentially be on the cards, the current market structure suggests a bullish exhaustion in the coming sessions.
  • The RSI and MACD are bullishly configured while the Stochastic indicator is in the overbought zone. 
  • A failure below the 2018 high would likely see a retest of the 97.00 figure. 
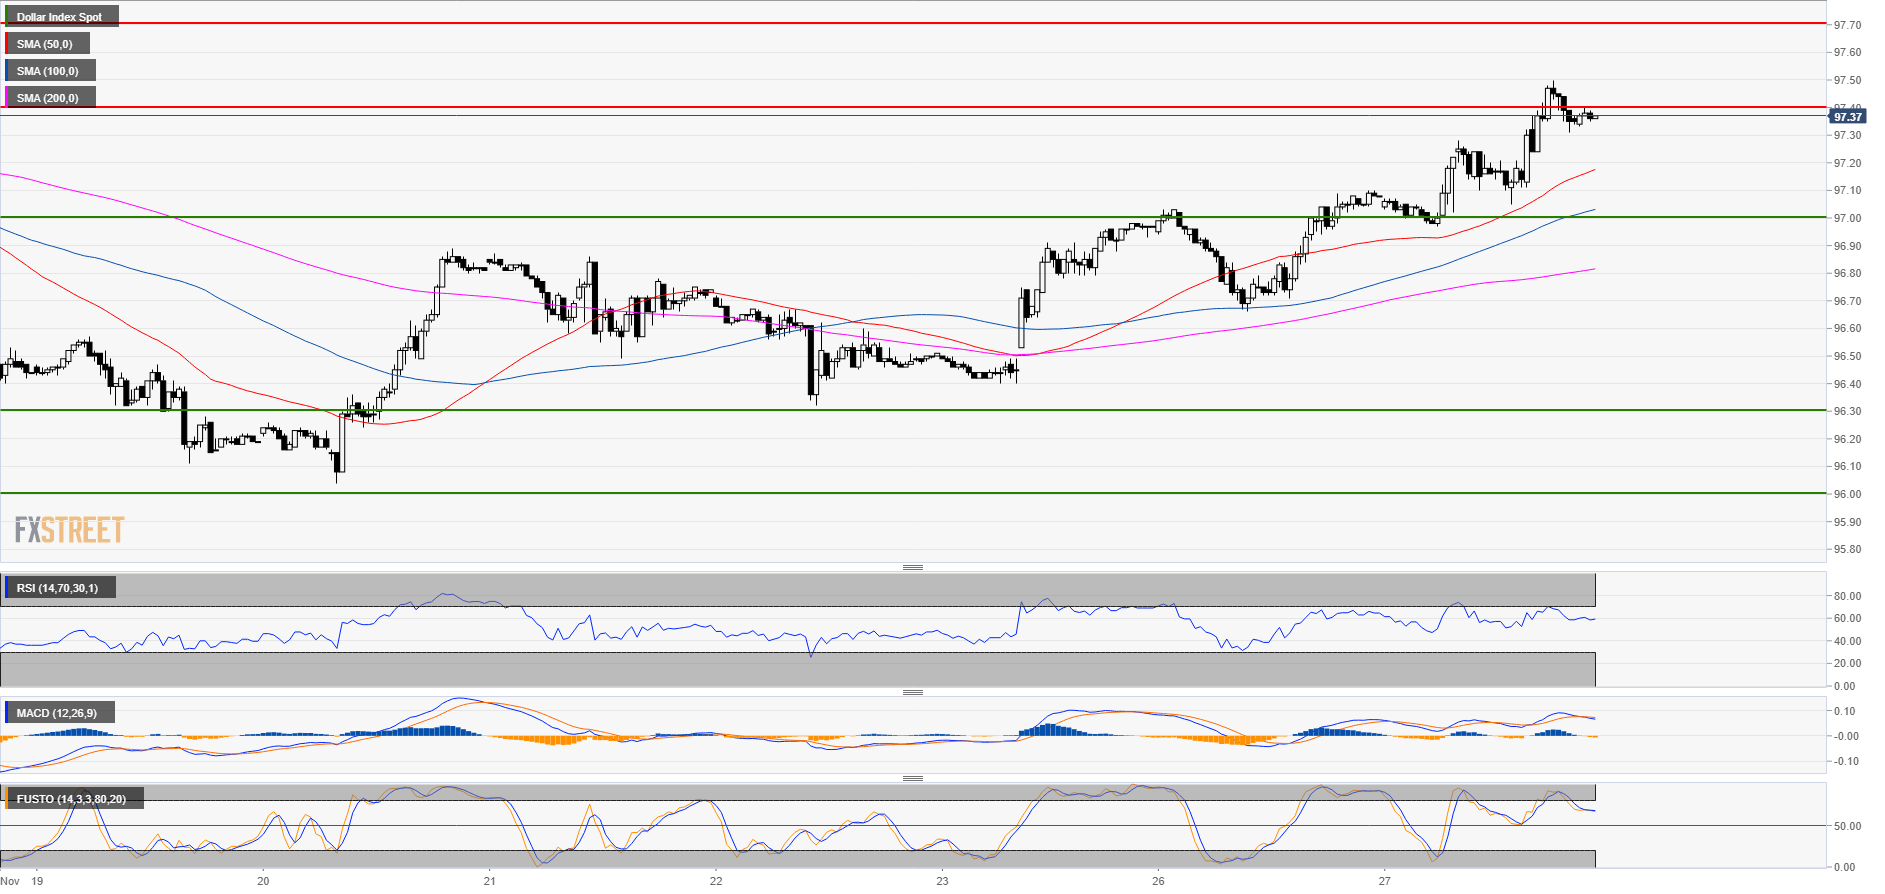
DXY 30-minute chart

  • The lower time-frames are still quite bullish with DXY above the 50, 100 and 200 SMAs. 

Additional key levels 

Dollar Index Spot

Overview:
    Today Last Price: 97.36
    Today Daily change: 28 pips
    Today Daily change %: 0.288%
    Today Daily Open: 97.08
Trends:
    Previous Daily SMA20: 96.75
    Previous Daily SMA50: 95.92
    Previous Daily SMA100: 95.52
    Previous Daily SMA200: 93.76
Levels:
    Previous Daily High: 97.1
    Previous Daily Low: 96.66
    Previous Weekly High: 96.98
    Previous Weekly Low: 96.04
    Previous Monthly High: 97.2
    Previous Monthly Low: 94.79
    Previous Daily Fibonacci 38.2%: 96.93
    Previous Daily Fibonacci 61.8%: 96.83
    Previous Daily Pivot Point S1: 96.79
    Previous Daily Pivot Point S2: 96.51
    Previous Daily Pivot Point S3: 96.35
    Previous Daily Pivot Point R1: 97.23
    Previous Daily Pivot Point R2: 97.39
    Previous Daily Pivot Point R3: 97.67

Author

Flavio Tosti

Flavio Tosti

Independent Analyst


More from Flavio Tosti
Share:

Editor's Picks

EUR/USD loses ground below 1.1850 ahead of FOMC Minutes

The EUR/USD pair loses traction near 1.1840 during the early European session on Wednesday, pressured by renewed US Dollar demand. Traders brace for the Federal Open Market Committee Minutes for signals on future rate cuts, which will be released later on Wednesday. 

When is the UK CPI data and how could it affect GBP/USD?

The United Kingdom Consumer Price Index data for January is scheduled to be published today at 07:00 GMT. GBP/USD trades slightly lower at around 1.3556 as of writing. The 20-period Exponential Moving Average trends lower at 1.3593 and continues to cap rebounds. Price holds beneath this gauge, maintaining a short-term bearish bias.

Gold: Is the $5,000 level back in sight?

Gold snaps a two-day downtrend, as recovery gathers traction toward $5,000 on Wednesday. The US Dollar recovers from the overnight sell-off as rebalancing trades resume ahead of Fed Minutes. The 38.2% Fib support holds on the daily chart for now. What does that mean for Gold?

Pi Network rally defies market pressure ahead of its first anniversary

Pi Network is trading above $0.1900 at press time on Wednesday, extending the weekly gains by nearly 8% so far. The steady recovery is supported by a short-term pause in mainnet migration, which reduces pressure on the PI token supply for Centralized Exchanges. The technical outlook focuses on the $0.1919 resistance as bullish momentum increases.

UK jobs market weakens, bolstering rate cut hopes

In the UK, the latest jobs report made for difficult reading. Nonetheless, this represents yet another reminder for the Bank of England that they need to act swiftly given the collapse in inflation expected over the coming months. 

Top 3 Price Prediction: Bitcoin, Ethereum, and Ripple face downside risk as bears regain control

Bitcoin, Ethereum, and Ripple remain under pressure on Wednesday, with the broader trend still sideways. BTC is edging below $68,000, nearing the lower consolidating boundary, while ETH and XRP also declined slightly, approaching their key supports.