|
US Dollar Index Technical Analysis: DXY bulls are away on Easter holiday

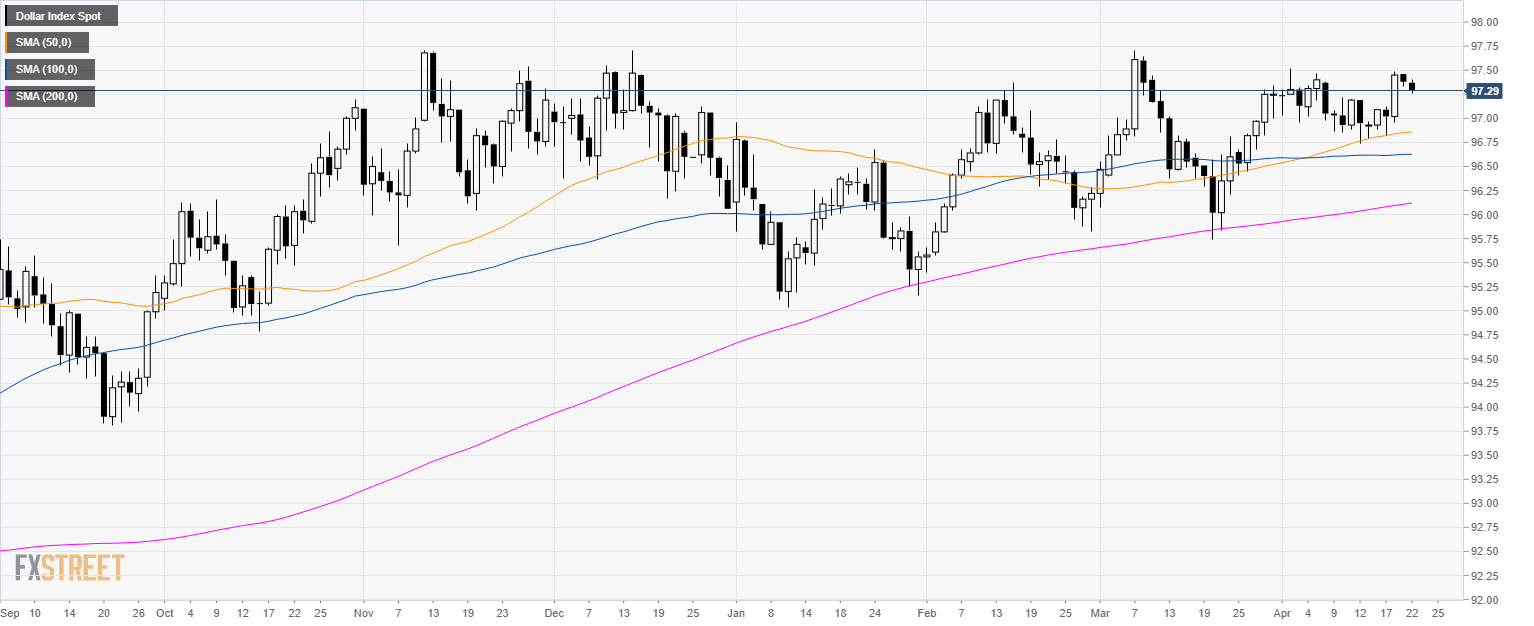
DXY daily chart
- The US Dollar Index (DXY) is trading in a bull trend above its 200-day simple moving average (SMA).
- After creating an inside day on Good Friday, DXY has weakened a little bit more on Easter Monday.
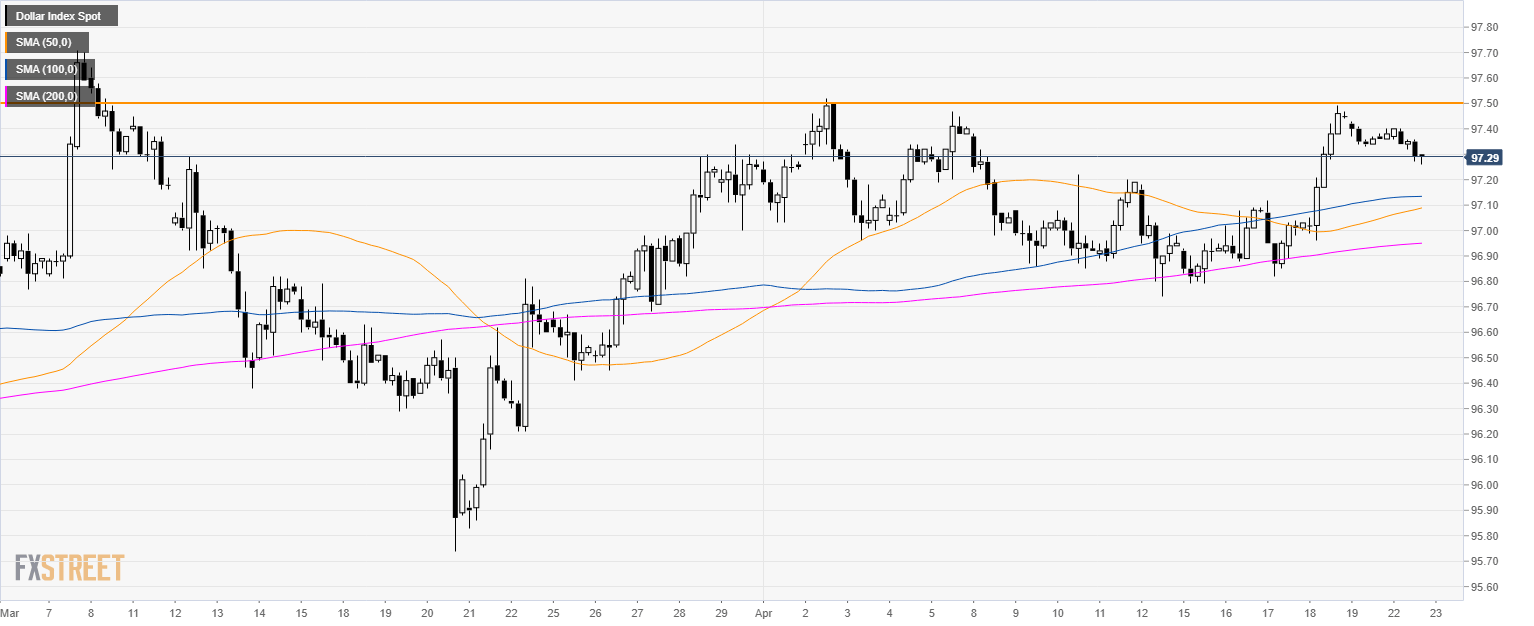
DXY 4-hour chart
- DXY is trading above its main SMAs suggesting bullish momentum in the medium-term.
- 97.50 is the highest price in April and that is the level to beat if bulls want to extend the uptrend.
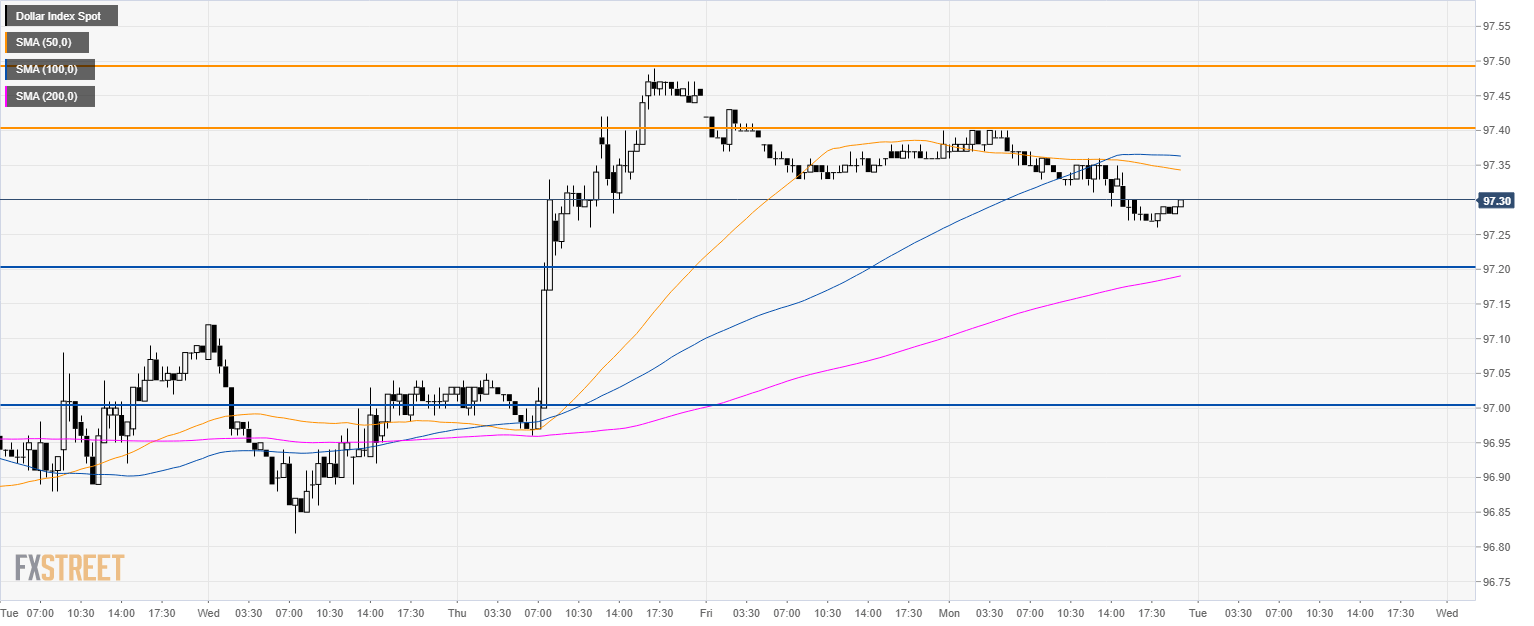
DXY 30-minute chart
- Bulls would need to overcome 97.40/50 resistances if they want to revisit the 2019 high at 97.70.
- As the market is trading below its 50 and 100 SMA, DXY is most likely going to revisit 97.20 and 97.00 key support during the week.
Additional key levels
Author

Flavio Tosti
Independent Analyst
More from Flavio Tosti


