US Dollar Index Price Forecast: Hovers around 99.00, with a persistent bearish bias
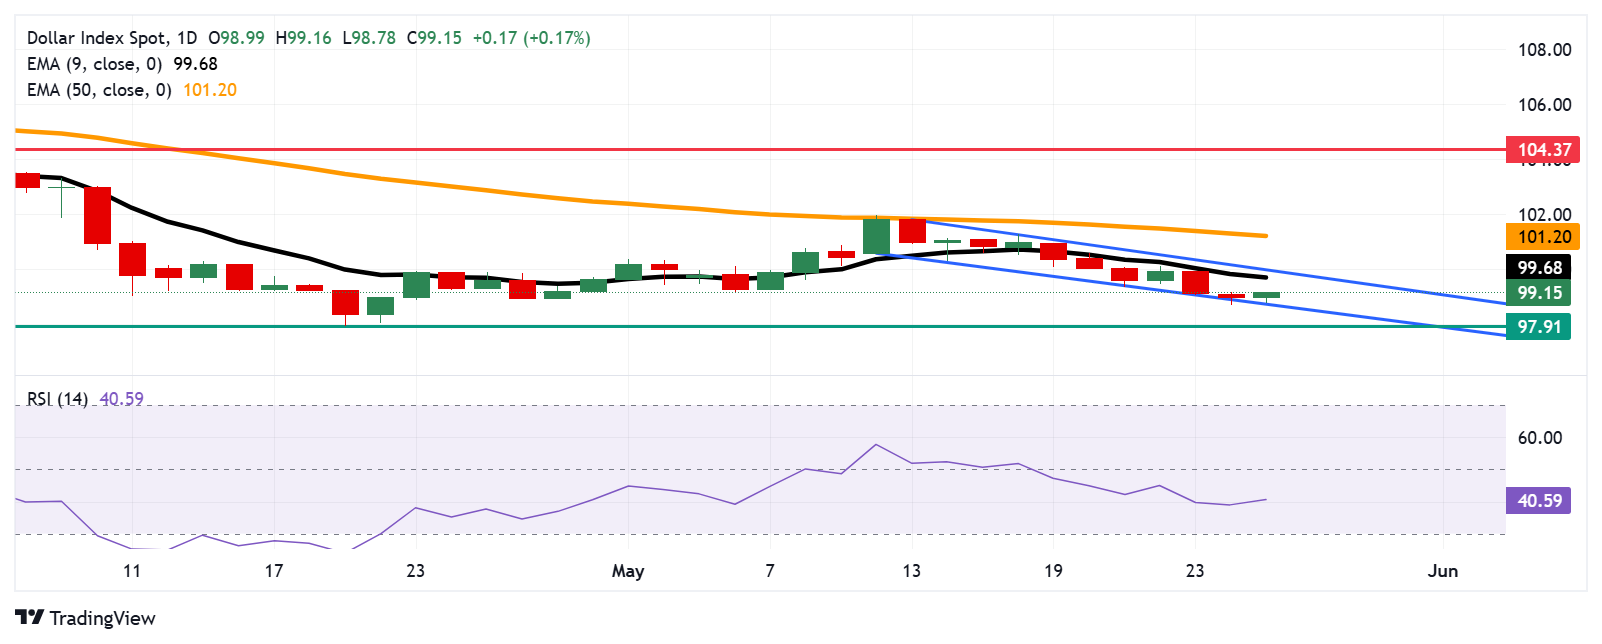
- The US Dollar finds primary support at the lower boundary of the descending channel around 98.70.
- Technical analysis indicates a persistent bearish bias as the RSI stays below the 50 level.
- The nine-day EMA of 99.68 appears as the initial barrier, followed by the descending channel’s upper boundary around 100.00.

The US Dollar Index (DXY), which measures the value of the US Dollar (USD) against six major currencies, is retracing its recent losses from the previous session. The DXY is trading around 98.80 during the Asian hours on Tuesday.
On the daily chart, technical analysis suggested a persistent bearish bias, with the index moving downwards within a descending channel pattern. Additionally, the DXY remains below the nine-day Exponential Moving Average (EMA), indicating that short-term momentum is weaker. Additionally, the 14-day Relative Strength Index (RSI) stays below the 50 level, indicating reinforcement of the bearish bias.
On the downside, immediate support appears at the lower boundary of the descending channel around 98.70. A break below the channel would reinforce the bearish bias and put downward pressure on the US Dollar Index to navigate the area around 97.91 — the lowest level since March 2022, which was recorded on April 21.
To the upside, the US Dollar Index may target the initial barrier at the nine-day EMA of 99.68, followed by the descending channel’s upper boundary around 100.00. A break above this crucial resistance zone could cause the emergence of the bullish bias and support the DXY to test the 50-day EMA at the 101.20 level. A break above this level could strengthen the short-term price momentum and support the index to explore the area around the two-month high at 104.37, reached on April 1.
(This story was corrected on May 27 at 06:50 GMT to say, in the third bullet and the last paragraph, that the US Dollar Index may target the initial barrier at the nine-day EMA, followed by the descending channel’s upper boundary, not the ascending channel.)
US Dollar Index: Daily Chart
US Dollar PRICE Today
The table below shows the percentage change of US Dollar (USD) against listed major currencies today. US Dollar was the strongest against the New Zealand Dollar.
| USD | EUR | GBP | JPY | CAD | AUD | NZD | CHF | |
|---|---|---|---|---|---|---|---|---|
| USD | 0.11% | 0.15% | 0.16% | 0.07% | 0.39% | 0.45% | 0.13% | |
| EUR | -0.11% | 0.03% | 0.07% | -0.03% | 0.21% | 0.24% | 0.00% | |
| GBP | -0.15% | -0.03% | 0.04% | -0.06% | 0.16% | 0.21% | -0.06% | |
| JPY | -0.16% | -0.07% | -0.04% | -0.07% | 0.23% | 0.20% | -0.03% | |
| CAD | -0.07% | 0.03% | 0.06% | 0.07% | 0.30% | 0.29% | 0.00% | |
| AUD | -0.39% | -0.21% | -0.16% | -0.23% | -0.30% | -0.05% | -0.32% | |
| NZD | -0.45% | -0.24% | -0.21% | -0.20% | -0.29% | 0.05% | -0.31% | |
| CHF | -0.13% | -0.01% | 0.06% | 0.03% | -0.00% | 0.32% | 0.31% |
The heat map shows percentage changes of major currencies against each other. The base currency is picked from the left column, while the quote currency is picked from the top row. For example, if you pick the US Dollar from the left column and move along the horizontal line to the Japanese Yen, the percentage change displayed in the box will represent USD (base)/JPY (quote).
Author

Akhtar Faruqui
FXStreet
Akhtar Faruqui is a Forex Analyst based in New Delhi, India. With a keen eye for market trends and a passion for dissecting complex financial dynamics, he is dedicated to delivering accurate and insightful Forex news and analysis.