|

US Dollar Index Price Analysis: Key support remains at the mid-91.00s

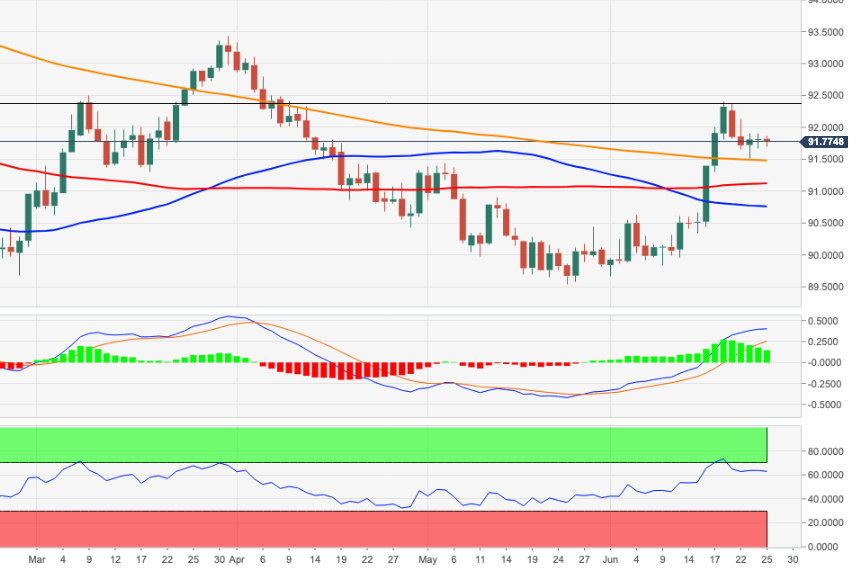
  • DXY extends the consolidation below the 92.00 yardstick.
  • The 200-day SMA near 91.50 emerges as a key support.

DXY moves within a rangebound pattern in the lower end of the weekly range, always in the sub-92.00 area.

If the selling impulse gathers extra steam, then another visit to the critical 200-day SMA, today at 91.48, should not be ruled out.

In the meantime, and looking at the broader scenario, a sustainable breakout of the 200-day SMA should shift the outlook for the buck to positive.

DXY daily chart

Dollar Index Spot

Overview
Today last price91.75
Today Daily Change16
Today Daily Change %-0.08
Today daily open91.82
 
Trends
Daily SMA2090.75
Daily SMA5090.66
Daily SMA10091.12
Daily SMA20091.49
 
Levels
Previous Daily High91.91
Previous Daily Low91.66
Previous Weekly High92.4
Previous Weekly Low90.35
Previous Monthly High91.44
Previous Monthly Low89.54
Daily Fibonacci 38.2%91.81
Daily Fibonacci 61.8%91.75
Daily Pivot Point S191.68
Daily Pivot Point S291.55
Daily Pivot Point S391.44
Daily Pivot Point R191.93
Daily Pivot Point R292.04
Daily Pivot Point R392.17

Author

Pablo Piovano

Born and bred in Argentina, Pablo has been carrying on with his passion for FX markets and trading since his first college years.

More from Pablo Piovano
Share:

Editor's Picks

EUR/USD loses ground below 1.1850 ahead of FOMC Minutes

The EUR/USD pair loses traction near 1.1840 during the early European session on Wednesday, pressured by renewed US Dollar demand. Traders brace for the Federal Open Market Committee Minutes for signals on future rate cuts, which will be released later on Wednesday. 

When is the UK CPI data and how could it affect GBP/USD?

The United Kingdom Consumer Price Index data for January is scheduled to be published today at 07:00 GMT. GBP/USD trades slightly lower at around 1.3556 as of writing. The 20-period Exponential Moving Average trends lower at 1.3593 and continues to cap rebounds. Price holds beneath this gauge, maintaining a short-term bearish bias.

Gold: Is the $5,000 level back in sight?

Gold snaps a two-day downtrend, as recovery gathers traction toward $5,000 on Wednesday. The US Dollar recovers from the overnight sell-off as rebalancing trades resume ahead of Fed Minutes. The 38.2% Fib support holds on the daily chart for now. What does that mean for Gold?

Pi Network rally defies market pressure ahead of its first anniversary

Pi Network is trading above $0.1900 at press time on Wednesday, extending the weekly gains by nearly 8% so far. The steady recovery is supported by a short-term pause in mainnet migration, which reduces pressure on the PI token supply for Centralized Exchanges. The technical outlook focuses on the $0.1919 resistance as bullish momentum increases.

UK jobs market weakens, bolstering rate cut hopes

In the UK, the latest jobs report made for difficult reading. Nonetheless, this represents yet another reminder for the Bank of England that they need to act swiftly given the collapse in inflation expected over the coming months. 

Top 3 Price Prediction: Bitcoin, Ethereum, and Ripple face downside risk as bears regain control

Bitcoin, Ethereum, and Ripple remain under pressure on Wednesday, with the broader trend still sideways. BTC is edging below $68,000, nearing the lower consolidating boundary, while ETH and XRP also declined slightly, approaching their key supports.