US Dollar Index Price Analysis: DXY stays depressed around 96.00 inside nearby rising channel
- US Dollar Index remains pressured after easing from one-week high on Tuesday.
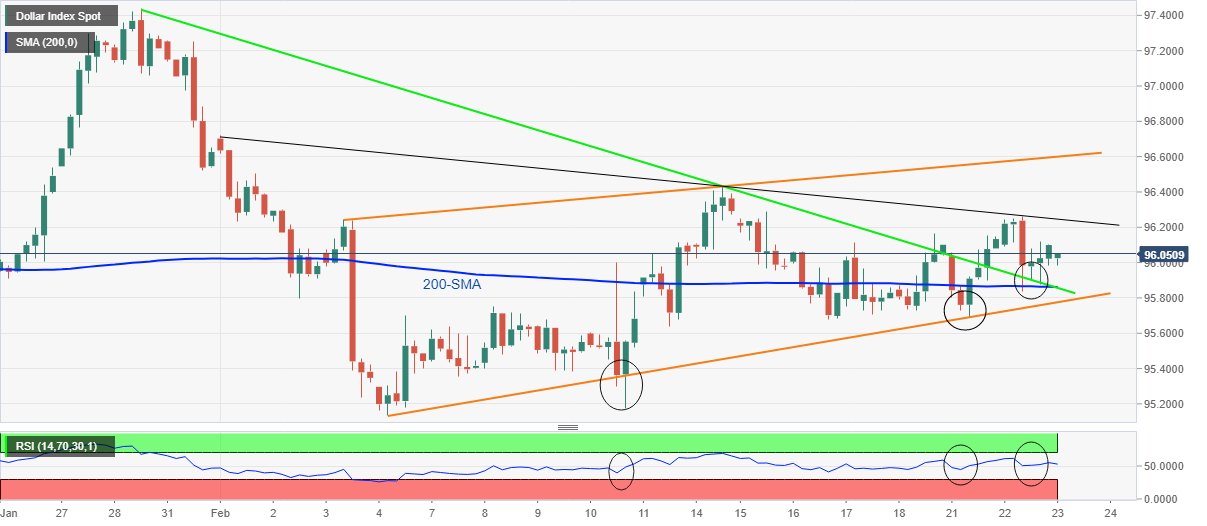
- 200-SMA, previous resistance line from late January restricts immediate declines.
- Bullish RSI divergence, chart pattern keeps buyers hopeful above 95.75.

US Dollar Index (DXY) bounces off intraday low to 96.03 while keeping the previous day’s pullback from weekly top to Wednesday’s Asian session.
Even so, the greenback gauge remains above the 95.85 resistance-turned-support confluence while staying inside a three-week-old ascending trend channel bullish chart pattern.
It should be noted that higher lows of prices and RSI, known as bullish divergence, also keep US Dollar Index on the optimist’s radar until the quote drops below the stated channel’s support line, near 95.75 by the press time.
However, pullback moves towards the convergence of the 200-SMA and previous resistance line from January 28, near 95.85, can’t be ruled out.
In a case where DXY drops below 95.75, the odds of witnessing a fall towards the monthly low of 95.13 can’t be ruled out.
Meanwhile, recovery moves may aim for a three-week-long descending trend line inside the channel, close to 96.25 at the latest, a break of which will direct the US Dollar Index to the channel’s upper line near 96.60.
During the run-up, the monthly high of 96.43 may act as an intermediate halt whereas the 97.00 threshold and January’s peak of 97.44 will lure the DXY bulls afterward.
DXY: Four-hour chart
Trend: Further upside expected
Author

Anil Panchal
FXStreet
Anil Panchal has nearly 15 years of experience in tracking financial markets. With a keen interest in macroeconomics, Anil aptly tracks global news/updates and stays well-informed about the global financial moves and their implications.


