US Dollar Index Price Analysis: DXY bears approach 105.40 after the biggest monthly fall in 12 years


  • US Dollar Index stays pressured after reversing from 21-DMA.
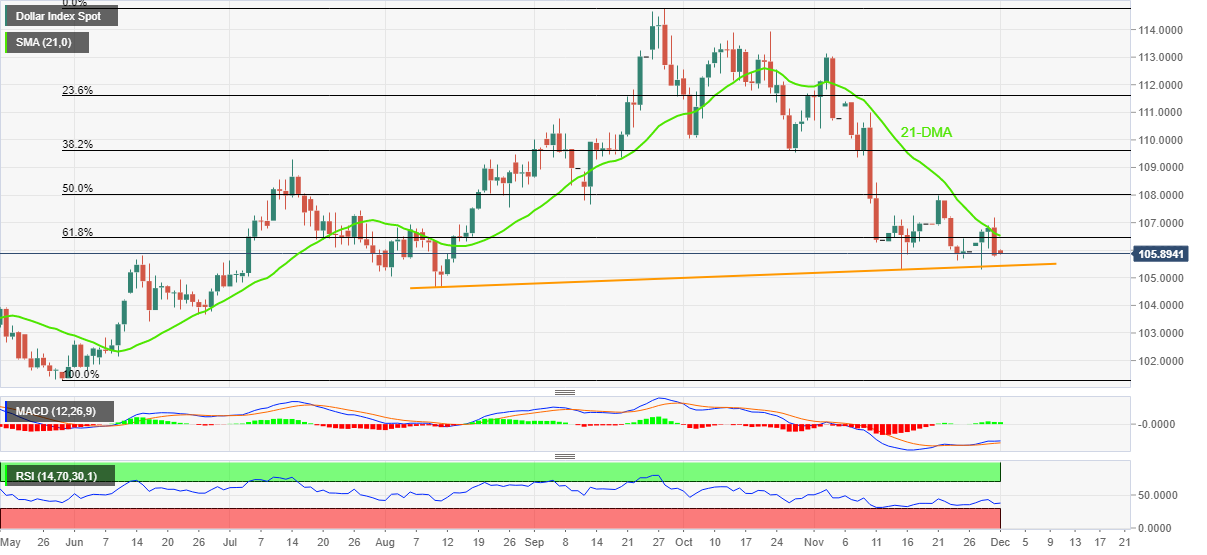
  • Four-month-old ascending support line lures bears but further downside appears limited.
  • 61.8% Fibonacci retracement level acts as immediate resistance.

US Dollar Index (DXY) bears keep the reins around 105.90 during early Thursday, taking a breather after posting the biggest monthly slump since September 2010.

The Greenback’s gauge versus the six major currencies reversed from the 21-Day Moving Average (DMA) the previous day to print the latest losses. The bearish move also gained clues from sluggish Moving Average Convergence and Divergence (MACD) and downbeat Relative Strength Index (RSI) line, placed at 14, not oversold.

With these conditions met, the DXY sellers are all set to approach an upward-sloping support line from early August, around 105.40.

However, the likely oversold RSI conditions around 105.40 support might stop the US Dollar bears around then, if not then the monthly low near 105.30 and the 105.00 round figure may challenge the quote’s further downside. Also acting as a downside filter is August month’s bottom surrounding 104.65.

Alternatively, the 61.8% Fibonacci retracement level, also known as the golden ratio, of the DXY’s May-September upside, near 106.45, restricts nearby upside move.

Following that, the 21-DMA level of 106.52 and the latest swing high near 107.20 could test the DXY bulls.

It’s worth noting, however, that the US Dollar Index remains on the bear’s radar unless crossing July’s high near 109.30. That said, the 50% Fibonacci retracement level surrounding 108.00 acts as an extra filter to the north.

US Dollar Index: Daily chart

Trend: Limited downside expected

Additional important levels

Overview
Today last price 105.91
Today Daily Change -0.90
Today Daily Change % -0.84%
Today daily open 106.81
 
Trends
Daily SMA20 106.66
Daily SMA50 109.67
Daily SMA100 109.24
Daily SMA200 105.93
 
Levels
Previous Daily High 106.89
Previous Daily Low 106.06
Previous Weekly High 108
Previous Weekly Low 105.63
Previous Monthly High 113.95
Previous Monthly Low 109.54
Daily Fibonacci 38.2% 106.57
Daily Fibonacci 61.8% 106.38
Daily Pivot Point S1 106.28
Daily Pivot Point S2 105.76
Daily Pivot Point S3 105.46
Daily Pivot Point R1 107.11
Daily Pivot Point R2 107.41
Daily Pivot Point R3 107.93


Share: Feed news

Information on these pages contains forward-looking statements that involve risks and uncertainties. Markets and instruments profiled on this page are for informational purposes only and should not in any way come across as a recommendation to buy or sell in these assets. You should do your own thorough research before making any investment decisions. FXStreet does not in any way guarantee that this information is free from mistakes, errors, or material misstatements. It also does not guarantee that this information is of a timely nature. Investing in Open Markets involves a great deal of risk, including the loss of all or a portion of your investment, as well as emotional distress. All risks, losses and costs associated with investing, including total loss of principal, are your responsibility. The views and opinions expressed in this article are those of the authors and do not necessarily reflect the official policy or position of FXStreet nor its advertisers. The author will not be held responsible for information that is found at the end of links posted on this page.

If not otherwise explicitly mentioned in the body of the article, at the time of writing, the author has no position in any stock mentioned in this article and no business relationship with any company mentioned. The author has not received compensation for writing this article, other than from FXStreet.

FXStreet and the author do not provide personalized recommendations. The author makes no representations as to the accuracy, completeness, or suitability of this information. FXStreet and the author will not be liable for any errors, omissions or any losses, injuries or damages arising from this information and its display or use. Errors and omissions excepted.

The author and FXStreet are not registered investment advisors and nothing in this article is intended to be investment advice.

Recommended content


Recommended content

Editors’ Picks

AUD/USD keeps the red below 0.6400 as Middle East war fears mount

AUD/USD keeps the red below 0.6400 as Middle East war fears mount

AUD/USD is keeping heavy losses below 0.6400, as risk-aversion persists following the news that Israel retaliated with missile strikes on a site in Iran. Fears of the Israel-Iran strife translating into a wider regional conflict are weighing on the higher-yielding Aussie Dollar. 

AUD/USD News

USD/JPY recovers above 154.00 despite Israel-Iran escalation

USD/JPY recovers above 154.00 despite Israel-Iran escalation

USD/JPY is recovering ground above 154.00 after falling hard on confirmation of reports of an Israeli missile strike on Iran, implying that an open conflict is underway and could only spread into a wider Middle East war. Safe-haven Japanese Yen jumped, helped by BoJ Governor Ueda's comments. 

USD/JPY News

Gold price pares gains below $2,400, geopolitical risks lend support

Gold price pares gains below $2,400, geopolitical risks lend support

Gold price is paring gains to trade back below  $2,400 early Friday, Iran's downplaying of Israel's attack has paused the Gold price rally but the upside remains supported amid mounting fears over a potential wider Middle East regional conflict. 

Gold News

WTI surges to $85.00 amid Israel-Iran tensions

WTI surges to $85.00 amid Israel-Iran tensions

Western Texas Intermediate, the US crude oil benchmark, is trading around $85.00 on Friday. The black gold gains traction on the day amid the escalating tension between Israel and Iran after a US official confirmed that Israeli missiles had hit a site in Iran.

Oil News

Dogwifhat price pumps 5% ahead of possible Coinbase effect

Dogwifhat price pumps 5% ahead of possible Coinbase effect

Dogwifhat price recorded an uptick on Thursday, going as far as to outperform its peers in the meme coins space. Second only to Bonk Inu, WIF token’s show of strength was not just influenced by Bitcoin price reclaiming above $63,000.

Read more

Forex MAJORS

Cryptocurrencies

Signatures