|

US Dollar Index Price Analysis: A move above the 2021 high remains on the cards

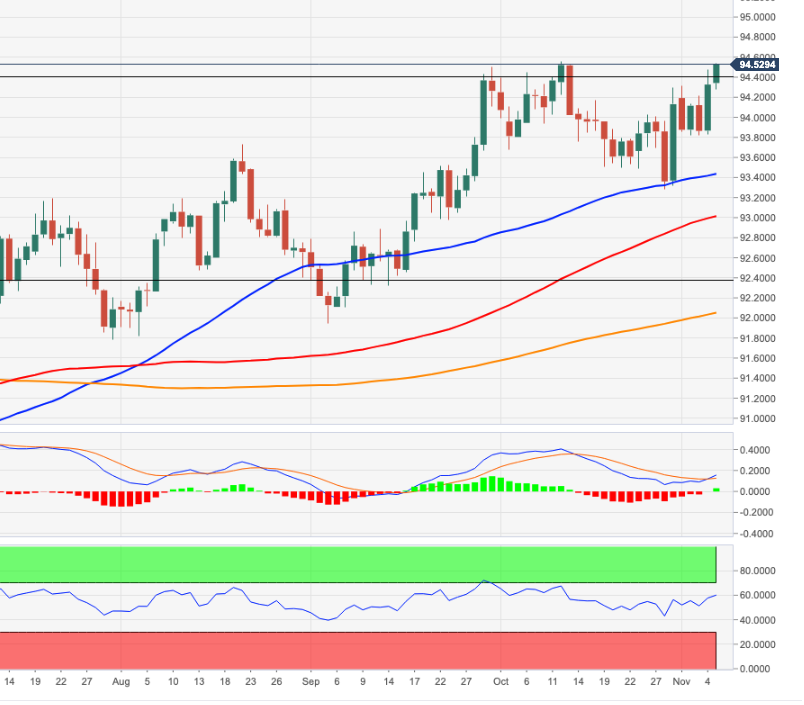
  • DXY adds to recent gains and approaches the YTD peak.
  • A break above 94.56 opens the door to test 94.74.

The buying pressure around the dollar extends for the second straight session and motivates DXY to flirt with the 2021 high in the mid-94.00s (October 12).

If the yearly tops are cleared, then the focus of attention is expected to gyrate to the September 2020 top at 94.74 ahead of the round level at 95.00 in the short-term horizon.

Extra gains remain well in the pipeline as long as the index navigates above the short-term resistance line (off the September low) near 93.50.

DXY daily chart

Dollar Index Spot

Overview
Today last price94.53
Today Daily Change27
Today Daily Change %0.21
Today daily open94.33
 
Trends
Daily SMA2093.95
Daily SMA5093.46
Daily SMA10092.99
Daily SMA20092.03
 
Levels
Previous Daily High94.47
Previous Daily Low93.83
Previous Weekly High94.3
Previous Weekly Low93.28
Previous Monthly High94.56
Previous Monthly Low93.28
Daily Fibonacci 38.2%94.23
Daily Fibonacci 61.8%94.08
Daily Pivot Point S193.95
Daily Pivot Point S293.57
Daily Pivot Point S393.3
Daily Pivot Point R194.59
Daily Pivot Point R294.85
Daily Pivot Point R395.23

Author

Pablo Piovano

Born and bred in Argentina, Pablo has been carrying on with his passion for FX markets and trading since his first college years.

More from Pablo Piovano
Share:

Editor's Picks

EUR/USD weakens below 1.1700 as Middle East tensions drive US Dollar strength

The EUR/USD pair trades with mild losses around 1.1685, the lowest since late January, during the early Asian session on Tuesday. The US Dollar gathers strength against the Euro as escalating tensions in the Middle East boost safe-haven currencies. The preliminary reading of the Harmonized Index of Consumer Prices from the Eurozone will be published later on Tuesday.  

GBP/USD hovers around 1.3400 with bearish pressure intact

GBP/USD edges higher after three days of losses, trading around 1.3400 during the Asian hours on Tuesday. The technical analysis of the daily chart indicates an ongoing bearish bias, as the pair trades within a descending channel pattern.

Gold defends bids as US-Iran war continues to fuel safe-haven flows

Gold retains positive bias for the fifth consecutive day on Tuesday as rising geopolitical tensions in the Middle East continue to underpin safe-haven assets. However, a bullish US Dollar keeps the bullion below its highest level since late January, set on Monday, warranting caution before positioning for any further appreciation.

Strategy lifts holdings to 3.4% of Bitcoin's total supply amid inflows into crypto products

Strategy continued its accumulation of the top crypto last week, acquiring 3,015 BTC for $204 million amid renewed interest in crypto products after four weeks of outflows.

The market is not panicking it is repricing the probability distribution of Oil and time

At the end of the day, markets do not trade morality or geopolitics. They trade transmission channels. And the only channel that truly matters in this maelstrom runs through the price of energy and the time value of money.

Grass 20% bullish breakout defies broader market weakness

Grass (GRASS) is edging up above $0.30 at the time of writing on Monday. The token’s notable 20% intraday surge stands out amid heightened volatility in the broader crypto market.