US Dollar Index keeps the sub-93.00 area post-data, looks to FOMC


  • DXY remains on the defensive in the 92.80 region after US data.
  • The Empire State index surpassed estimates at 17.00 in September.
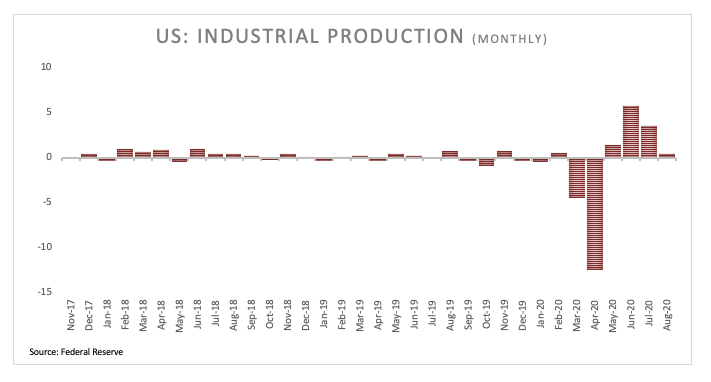
  • US Industrial Production missed expectations in August.

The greenback remains under heavy pressure in the first half of the week and drags the US Dollar Index (DXY) to fresh 3-day lows in the 92.80 region.

US Dollar Index now looks to the FOMC event

The index is down for the third straight session on Tuesday, coming under increasing selling pressure in response to the persistent improvement in the risk complex.

In fact, positive results from the Chinese docket during early trade plus last week’s firm (ish) message from the European Central Bank have lifted spirits in the risk universe and motivated investors to resume the selling bias in the buck.

Tuesday’s mixed data in the US data space is not helping the buck either after the Empire State index rose more than expected to 17.00 for the current month and the Industrial Production expanded “just” 0.4% from a month earlier in August. Additional data saw Manufacturing Production also expanding less than forecasted by 1.0% MoM and Capacity Utilization ticking a tad higher to 71.4% (from 71.1%).

Later in the session, the Federal Reserve will start its 2-day meeting.

What to look for around USD

The rally in the dollar failed near 93.70 in the middle of last week, exposing the index to the resumption of the bearish trend. Occasional bullish attempts, however, are still considered as corrective only amidst the broad bearish stance surrounding the dollar. Supporting this view emerge a more dovish Fed, the unremitting progress of the coronavirus pandemic and political uncertainty ahead of the November elections. On the supportive side of the buck emerge occasional bouts of US-China tensions and the resumption of the risk aversion among investors.

US Dollar Index relevant levels

At the moment, the index is losing 0.16% at 92.90 and faces the next support at 92.70 (weekly low Sep.10) seconded by 91.92 (23.6% Fibo of the 2017-2018 drop) and then 91.75 (2020 low Sep.1). On the other hand, a break above 93.66 (monthly high Sep.9) would open the door to 93.99 (monthly high Aug.3) and finally 94.20 (38.2% Fibo of the 2017-2018 drop).

Share: Feed news

Information on these pages contains forward-looking statements that involve risks and uncertainties. Markets and instruments profiled on this page are for informational purposes only and should not in any way come across as a recommendation to buy or sell in these assets. You should do your own thorough research before making any investment decisions. FXStreet does not in any way guarantee that this information is free from mistakes, errors, or material misstatements. It also does not guarantee that this information is of a timely nature. Investing in Open Markets involves a great deal of risk, including the loss of all or a portion of your investment, as well as emotional distress. All risks, losses and costs associated with investing, including total loss of principal, are your responsibility. The views and opinions expressed in this article are those of the authors and do not necessarily reflect the official policy or position of FXStreet nor its advertisers. The author will not be held responsible for information that is found at the end of links posted on this page.

If not otherwise explicitly mentioned in the body of the article, at the time of writing, the author has no position in any stock mentioned in this article and no business relationship with any company mentioned. The author has not received compensation for writing this article, other than from FXStreet.

FXStreet and the author do not provide personalized recommendations. The author makes no representations as to the accuracy, completeness, or suitability of this information. FXStreet and the author will not be liable for any errors, omissions or any losses, injuries or damages arising from this information and its display or use. Errors and omissions excepted.

The author and FXStreet are not registered investment advisors and nothing in this article is intended to be investment advice.

Recommended content


Recommended content

Editors’ Picks

AUD/USD failed just ahead of the 200-day SMA

AUD/USD failed just ahead of the 200-day SMA

Finally, AUD/USD managed to break above the 0.6500 barrier on Wednesday, extending the weekly recovery, although its advance faltered just ahead of the 0.6530 region, where the key 200-day SMA sits.

AUD/USD News

EUR/USD met some decent resistance above 1.0700

EUR/USD met some decent resistance above 1.0700

EUR/USD remained unable to gather extra upside traction and surpass the 1.0700 hurdle in a convincing fashion on Wednesday, instead giving away part of the weekly gains against the backdrop of a decent bounce in the Dollar.

EUR/USD News

Gold keeps consolidating ahead of US first-tier figures

Gold keeps consolidating ahead of US first-tier figures

Gold finds it difficult to stage a rebound midweek following Monday's sharp decline but manages to hold above $2,300. The benchmark 10-year US Treasury bond yield stays in the green above 4.6% after US data, not allowing the pair to turn north.

Gold News

Bitcoin price could be primed for correction as bearish activity grows near $66K area

Bitcoin price could be primed for correction as bearish activity grows near $66K area

Bitcoin (BTC) price managed to maintain a northbound trajectory after the April 20 halving, despite bold assertions by analysts that the event would be a “sell the news” situation. However, after four days of strength, the tables could be turning as a dark cloud now hovers above BTC price.

Read more

Bank of Japan's predicament: The BOJ is trapped

Bank of Japan's predicament: The BOJ is trapped

In this special edition of TradeGATEHub Live Trading, we're joined by guest speaker Tavi @TaviCosta, who shares his insights on the Bank of Japan's current predicament, stating, 'The BOJ is Trapped.' 

Read more

Forex MAJORS

Cryptocurrencies

Signatures