- DXY corrects lower following recent tops above 101.00.
- US yields also recede from earlier highs and trade on the defensive.
- Fedspeak, housing data next on the US calendar on Wednesday.
The greenback, when tracked by the US Dollar Index (DXY), extends the corrective downside to the 100.70 region midweek.
US Dollar Index capped by the 101.00 area
The index comes under pressure and trades in the negative territory following four consecutive daily advances on Wednesday.
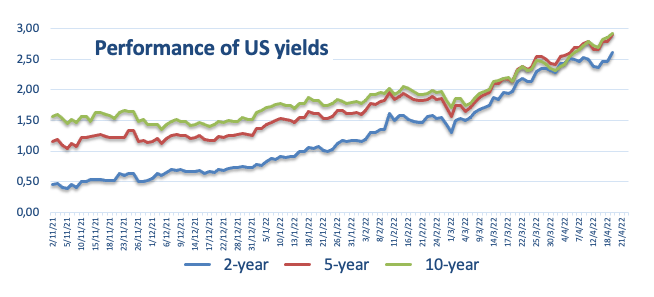
The corrective move in the buck comes amidst the equally negative performance in US yields on the back of a tepid recovery in the bonds market. Furthermore, yields along the curve ease some upside momentum after hitting fresh cycle highs on Tuesday.
No news from the war in Ukraine should leave the downside in the dollar somewhat contained for the time being.
In the US docket, usual weekly Mortgage Applications tracked by MBA are due seconded by Existing Home Sales and speeches by San Francisco Fed M.Daly (2024 voter, hawk) and Chicago Fed C.Evans (2023 voter, centrist).
What to look for around USD
The dollar’s rally surpassed albeit ephemerally the 101.00 mark in the first half of the week, although it came under some selling pressure afterwards. So far, the greenback’s price action continues to be dictated by the likeliness of a tighter rate path by the Fed and geopolitics. In addition, the case for a stronger dollar also remains well propped up by high US yields and the solid performance of the US economy.
Key events in the US this week: IMF World/Bank Spring Meetings, Existing Home Sales, Fed Beige Book (Wednesday) - IMF World/Bank Spring Meetings, Initial Claims, Philly Fed Index, Fed Powell (Thursday) - IMF World/Bank Spring Meetings, Flash Services/Manufacturing PMIs (Friday).
Eminent issues on the back boiler: Escalating geopolitical effervescence vs. Russia and China. Fed’s rate path this year. US-China trade conflict. Future of Biden’s Build Back Better plan.
US Dollar Index relevant levels
Now, the index is retreating 0.29% at 100.70 and faces initial contention at 99.57 (weekly low April 14) followed by 97.68 (weekly low March 30) and then 97.15 (100-day SMA). On the flip side, the breakout of 101.02 (2022 high April 19) would open the door to 101.91 (high March 25 2020) and finally 102.99 (2020 high March 20).
Information on these pages contains forward-looking statements that involve risks and uncertainties. Markets and instruments profiled on this page are for informational purposes only and should not in any way come across as a recommendation to buy or sell in these assets. You should do your own thorough research before making any investment decisions. FXStreet does not in any way guarantee that this information is free from mistakes, errors, or material misstatements. It also does not guarantee that this information is of a timely nature. Investing in Open Markets involves a great deal of risk, including the loss of all or a portion of your investment, as well as emotional distress. All risks, losses and costs associated with investing, including total loss of principal, are your responsibility. The views and opinions expressed in this article are those of the authors and do not necessarily reflect the official policy or position of FXStreet nor its advertisers. The author will not be held responsible for information that is found at the end of links posted on this page.
If not otherwise explicitly mentioned in the body of the article, at the time of writing, the author has no position in any stock mentioned in this article and no business relationship with any company mentioned. The author has not received compensation for writing this article, other than from FXStreet.
FXStreet and the author do not provide personalized recommendations. The author makes no representations as to the accuracy, completeness, or suitability of this information. FXStreet and the author will not be liable for any errors, omissions or any losses, injuries or damages arising from this information and its display or use. Errors and omissions excepted.
The author and FXStreet are not registered investment advisors and nothing in this article is intended to be investment advice.
Recommended content
Editors’ Picks
EUR/USD: Is the US Dollar corrective decline over? Premium
The EUR/USD pair ended a three-week losing streak, recovering towards 1.0600 before finally finding sellers. The US Dollar (USD) gapped lower at the weekly opening after reaching fresh 2024 highs against its European rival, with EUR/USD bottoming at 1.0332 on November 22.
GBP/USD: Pound Sterling rebounds, not out of the woods yet Premium
The Pound Sterling (GBP) snapped a two-week downtrend and staged a comeback against the US Dollar (USD), driving the GBP/USD pair back to the 1.2700 threshold.
Gold: Easing geopolitical tensions trigger profit-taking Premium
Gold (XAU/USD) declined sharply on easing geopolitical concerns on Monday and spent the rest of the week trying to recover its losses. Employment-related macroeconomic data releases from the US could alter the expectations about the Federal Reserve’s policy decision in December and trigger the next big action in XAU/USD.
Bitcoin: A healthy correction
Bitcoin (BTC) experienced a 7% correction earlier in the week, dropping to $90,791 on Tuesday before recovering to $97,000 by Friday. On-chain data suggests a modest rebound in institutional demand, with holders buying the dip. A recent report indicates BTC remains undervalued, projecting a potential rally toward $146K.
US Dollar flat ahead of weekend full of uncertainties over France's budget
The US Dollar (USD) is recovering with the US trading session opening on Black Friday. The rally in the Euro which was weighing on the US Dollar and the US Dollar Index (DXY), is fading at the start of the US trading session.
Best Forex Brokers with Low Spreads
VERIFIED Low spreads are crucial for reducing trading costs. Explore top Forex brokers offering competitive spreads and high leverage. Compare options for EUR/USD, GBP/USD, USD/JPY, and Gold.