|

US Dollar Index Asia Price Forecast: DXY on track to close above 2019 high, nearing the 100 figure

  • DXY is trading near 45-month high as the market is approaching the 100 mark.
  • Bulls are likely expecting a continuation of the bull move towards the 100.20 and 100.40 levels.
 

DXY daily chart

 
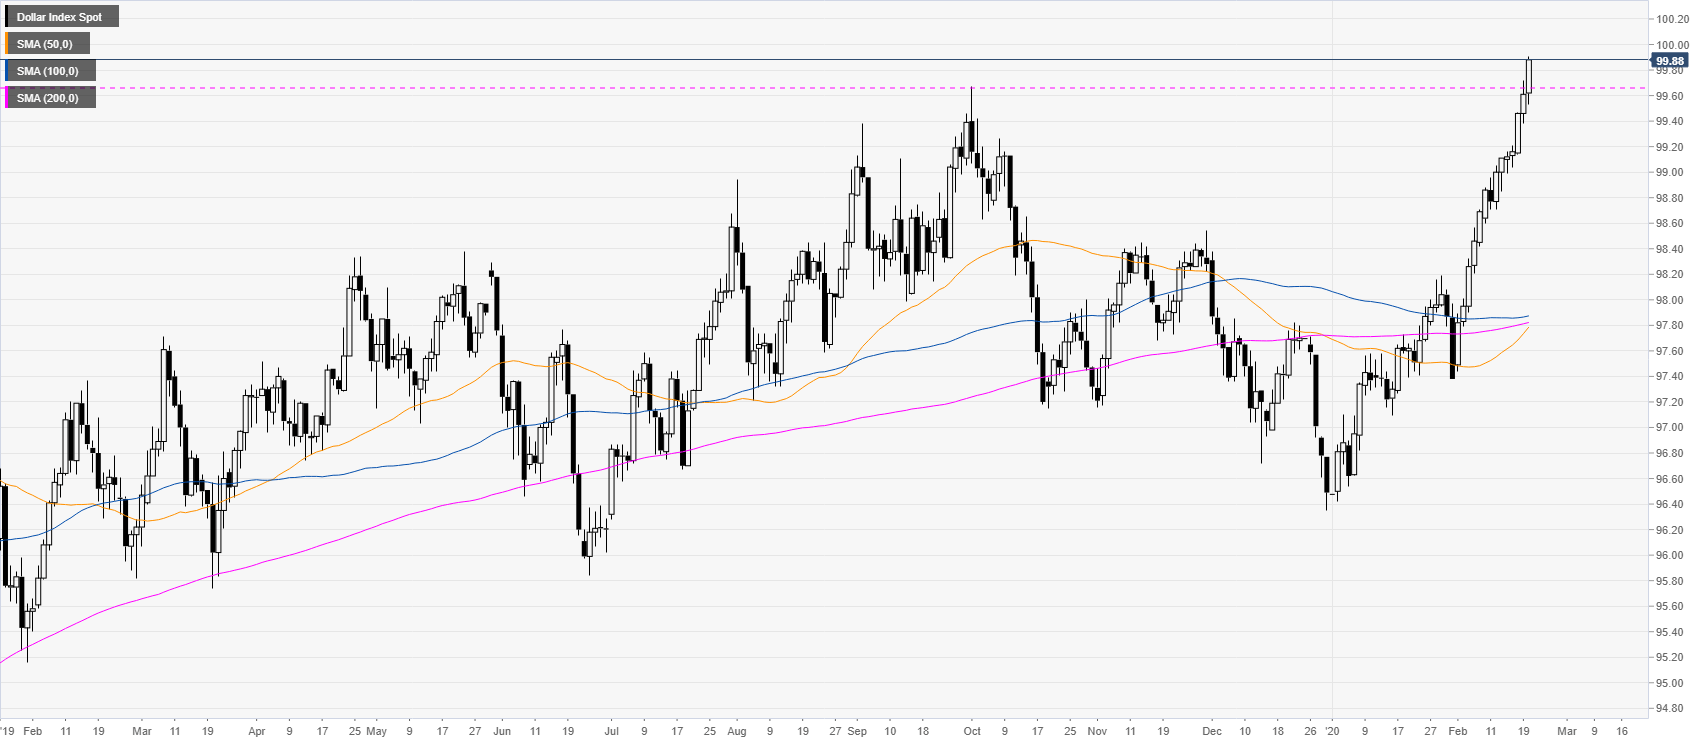
The US dollar index (DXY) is about to have a daily close above the 2019 high (at 99.67) as the market is nearing the 100 psychological level. 
 

DXY four-hour chart

 
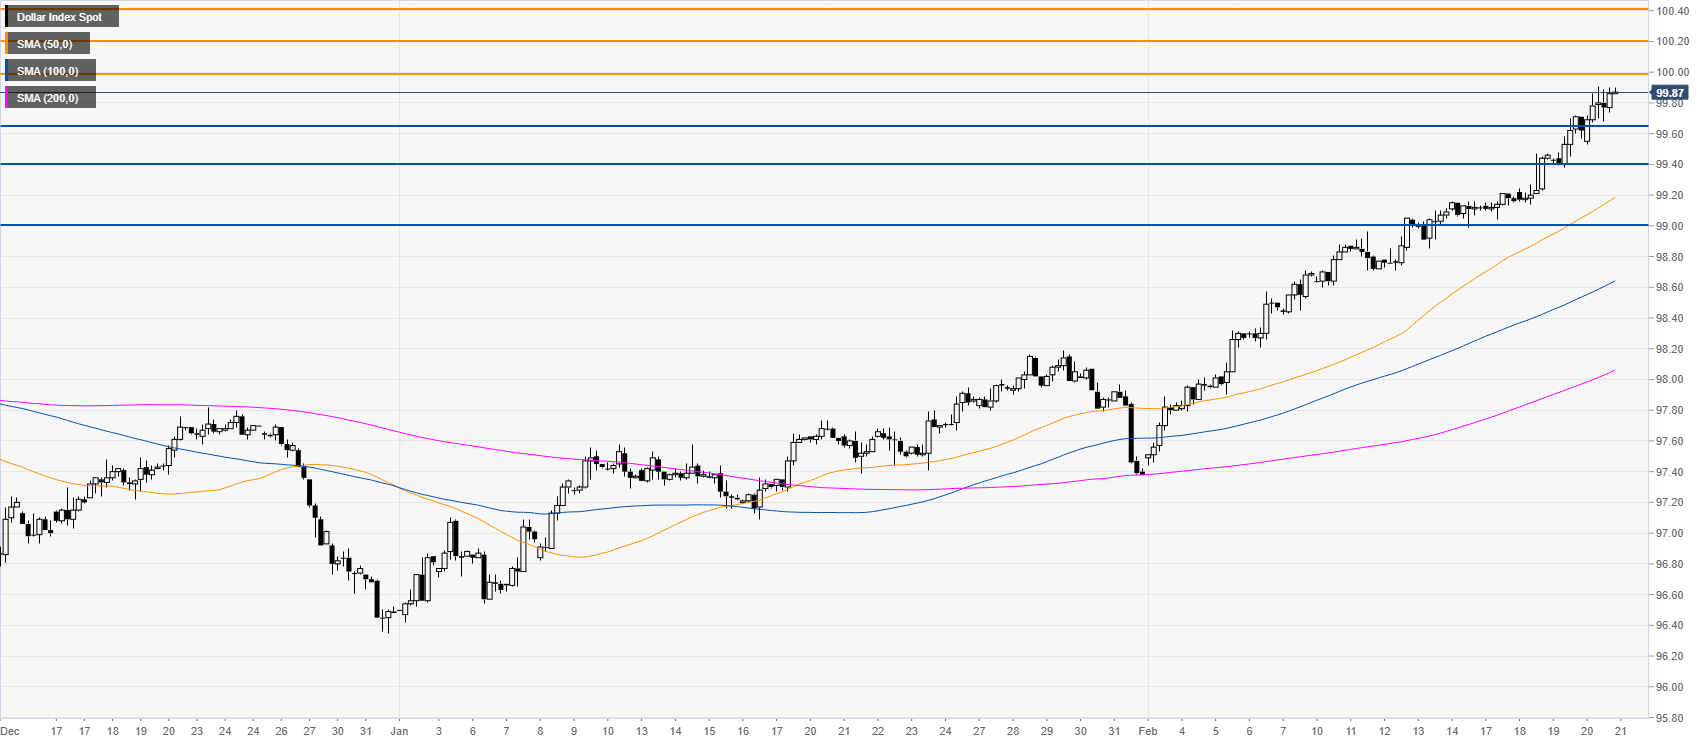
DXY is extending its longest run in several months as the bulls are nearing the 100 mark. The trend remains intact and a break above the above-mentioned level should expose higher levels near the 100.20 and 100.40 resistance. Support is seen near the 99.65 and 99.40 levels. 


Additional key levels

Dollar Index Spot

Overview
Today last price99.88
Today Daily Change0.27
Today Daily Change %0.27
Today daily open99.61
 
Trends
Daily SMA2098.45
Daily SMA5097.73
Daily SMA10097.87
Daily SMA20097.81
 
Levels
Previous Daily High99.72
Previous Daily Low99.38
Previous Weekly High99.16
Previous Weekly Low98.6
Previous Monthly High98.19
Previous Monthly Low96.42
Daily Fibonacci 38.2%99.59
Daily Fibonacci 61.8%99.51
Daily Pivot Point S199.42
Daily Pivot Point S299.23
Daily Pivot Point S399.08
Daily Pivot Point R199.76
Daily Pivot Point R299.91
Daily Pivot Point R3100.1

Author

Flavio Tosti

Flavio Tosti

Independent Analyst


More from Flavio Tosti

Share:

Editor's Picks

AUD/USD shows resilience below 38.2% Fibo. near mid-0.7100s

The AUD/USD pair touches a one-and-a-half-week low, around the 0.7140 region during the Asian session on Monday, though it lacks follow-through. Spot prices currently trade just above mid-0.7100s, down nearly 0.25% for the day.


USD/JPY: Japanese Yen edges lower vs USD amid Middle East jitters as Fed, BoJ meetings loom

The USD/JPY pair attracts some buyers at the start of a new week and climbs closer to the 154.00 mark during the Asian session, reversing a part of Friday's losses. Spot prices, however, remain confined in a range held over the past week or so and within striking distance of a nearly seven-month low, touched last Tuesday, as traders await this week's key central bank events.


Gold: Fed’s rate decision to drive the next move
Gold reflects a subdued performance at the start of the Federal Reserve’s (Fed) monetary policy week at around $4,330. Fed’s interest rate expectations heavily influenced last week after the release of the hot United States (US) Producer Price Index (PPI) and Consumer Price Index (CPI) reports for August.
Bitcoin consolidates, Ethereum faces hurdle, XRP nears key support
Bitcoin (BTC), Ethereum (ETH) and Ripple (XRP) start the week near crucial technical levels after a broadly bearish performance, correcting over 4%, 1.5% and 5% last week. BTC consolidates around $77,600, while ETH approaches key $2,550 resistance. Meanwhile, XRP trades near its key level around $1.354, making this support level crucial for its near-term outlook.
US Dollar Weekly Forecast: The last line of defense

There was no respite to the downward trend for the US Dollar this week, which added to the prior week’s retracement and at some point flirted with the area of four-month lows. Indeed, after trading at levels just shy of its psychological 100.00 barrier early in the month, the US Dollar Index has come all the way down to challenge the 98.50 zone, extending its negative streak for the third month in a row.

Venezuela’s 65-billion-barrel Oil deal could reshape America’s inflation fight
The United States (US) has secured unprecedented access to part of Venezuela’s vast Oil reserves. The timing is particularly significant as the war with Iran is disrupting Middle Eastern supplies, keeping energy prices elevated and reviving concerns about inflation.















