US Dollar back to flat with traders unable to read through the wall of numbers and headlines
- The US Dollar turns flat while US officials in Russia debate Ukraine ceasefire.
- Traders saw US PPI softer and weekly Jobless Claims come in positive.
- The US Dollar Index briefly popped above 104.00 after the PPI release before falling back.

The US Dollar Index (DXY), which tracks the performance of the US Dollar (USD) against six major currencies, is back below 104.00 after a brief pop on the back of softer PPI numbers. Markets await comments from US diplomats visiting Russia to convene over a ceasefire deal, which already bears the green light from Ukraine. Meanwhile US President Donald Trump threatened Europe with a 200% tariffs on all wines and champagnes coming from the region.
On the economic front, a bulk load of data has been released this Thursday at 12:30 GMT. Besides the weekly US Initial Jobless Claims, the US Producer Price Index (PPI) data for February came in. Markets anticipated another soft print in the producer’s inflation reading after the softer-than-expected US Consumer Price Index (CPI) released on Wednesday, which was the case for the PPI reading as well. .
Daily digest market movers: Reversing all around
- Markets are seeing US yields surge to a five-day high at 4.33% after hitting 4.15% earlier this week. The move is fueled by an outflow of position from US bonds and into US equities. Yields are inversely correlated with US bond prices, so if US bond prices drop, US yields surge, supporting a stronger US Dollar.
- The weekly US Jobless Claims and US Producer Price Index (PPI) for February have been released:
- Initial Jobless Claims for the week ending March 7 came in at 220,00, below the 225,000 expected. The Continuing Jobless Claims fell to 1.870 million, below the estimate 1.900 million.
- The monthly headline Producer Price Index for February fell to 0.0%, substantially below the 0.3% estimate and the 0.4% from last month. The monthly core PPI contracted even by 0.1%, far below the 0.3% estimate.
- The yearly headline PPI fell to 3.2%, just below the consensus of 3.3%, and further down from the 3.5% seen last month. The yearly core PPI reading, excluding food and energy, came in at 3.4%, just below the 3.5% expectqtion and from 3.6%.
- Initial reaction was supportive for the US Dollar, though after an hour of the release of the numbers, the move is being reversed. Traders see evidence in the softer PPI that actually demand is failing and might deteriorate further.
- Equities are dropping lower after the PPI headlines which were coming just after US President Trump mentioning a 200% tariff on European wines and champagnes.
- The CME Fedwatch Tool projects a 97.0% chance for no interest rate changes in the upcoming Fed meeting on March 19. The chances of a rate cut at the May 7 meeting stand at 28.1% and 76.9% at June’s meeting.
- The US 10-year yield trades around 4.34%, off its near five-month low of 4.10% printed on March 4 and at a five-day high.
US Dollar Index Technical Analysis: Does anyone know still?
The US Dollar Index (DXY) is getting some support from rising US yields after a softer US CPI report for February was released on Wednesday, opening the door for the Federal Reserve (Fed) to cut interest rates further in 2025. It all does sound contradictory, but those are the mechanics of how markets work, bringing tension with the Fed possibly cutting rates later this year while US yields are heading higher. Once the impact of US President Donald Trump’s tariffs on US inflation is clear, the direction for the US Dollar Index will become clear as well.
Upside risk is a rejection at 104.00 that could result in more downturn. If bulls can avoid that, look for a large sprint higher towards the 105.00 round level, with the 200-day Simple Moving Average (SMA) at 105.02. Once broken through that zone, a string of pivotal levels, such as 105.53 and 105.89, will present as caps.
On the downside, the 103.00 round level could be considered a bearish target in case US yields roll off again, with even 101.90 not unthinkable if markets further capitulate on their long-term US Dollar holdings.
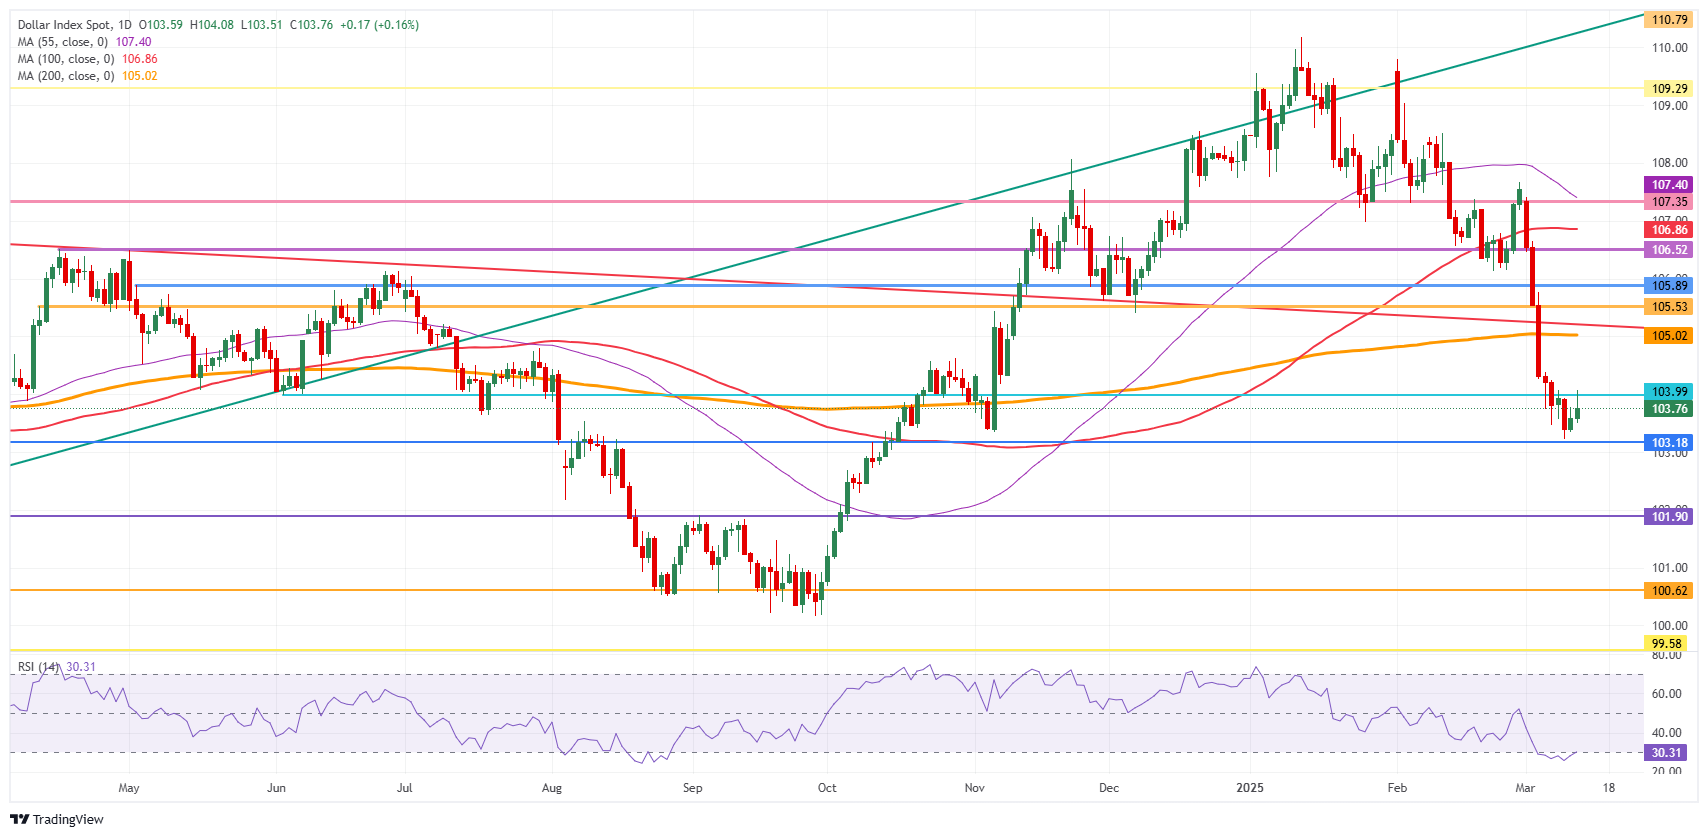
US Dollar Index: Daily Chart
Tariffs FAQs
Tariffs are customs duties levied on certain merchandise imports or a category of products. Tariffs are designed to help local producers and manufacturers be more competitive in the market by providing a price advantage over similar goods that can be imported. Tariffs are widely used as tools of protectionism, along with trade barriers and import quotas.
Although tariffs and taxes both generate government revenue to fund public goods and services, they have several distinctions. Tariffs are prepaid at the port of entry, while taxes are paid at the time of purchase. Taxes are imposed on individual taxpayers and businesses, while tariffs are paid by importers.
There are two schools of thought among economists regarding the usage of tariffs. While some argue that tariffs are necessary to protect domestic industries and address trade imbalances, others see them as a harmful tool that could potentially drive prices higher over the long term and lead to a damaging trade war by encouraging tit-for-tat tariffs.
During the run-up to the presidential election in November 2024, Donald Trump made it clear that he intends to use tariffs to support the US economy and American producers. In 2024, Mexico, China and Canada accounted for 42% of total US imports. In this period, Mexico stood out as the top exporter with $466.6 billion, according to the US Census Bureau. Hence, Trump wants to focus on these three nations when imposing tariffs. He also plans to use the revenue generated through tariffs to lower personal income taxes.
Author

Filip Lagaart
FXStreet
Filip Lagaart is a former sales/trader with over 15 years of financial markets expertise under its belt.


