US Dollar happy to head into the weekend at current levels
- The US Dollar is heading sideways on Friday after the US PCE reading for January.
- Traders saw no surprises in the PCE numbers which were in line of expectations.
- The US Dollar Index (DXY) locks in Thursday's gains above 107.00 and tries to hold the level before heading into the weekend.

The US Dollar Index (DXY), which tracks the performance of the US Dollar (USD) against six major currencies, looks set to close off this week around 107.30, which is the level at the time of writing on Friday. The DXY tries to keep a hold on that level. Markets got shaken up again overnight as United States (US) President Donald Trump confirmed that tariffs for Canada and Mexico are going into effect on March 4. Meanwhile, China will face an additional 10% levy on the same day.
On the economic data front, all eyes on Friday were on the Personal Consumption Expenditures (PCE) data for January. In the second reading of the US Gross Domestic Product (GBP) for the fourth quarter of 2024 on Thursday, the PCE components for both the headline and the core reading were revised up. Though the January numbers were in line of expectations and did not trigger or see any outside moves.
Daily digest market movers: Time to digest
- Ukraine President Volodymyr Zelenskyy is heading to Washington D.C. to sign a rare-earth deal with US President Donald Trump this Friday.
- The Personal Consumption Expenditures Price Index for January was nearly fully in line of expectations:
- The monthly headline PCE came in at 0.3%, unchanged from the previous reading.
- The monthly core PCE ticked up to 0.3% from 0.2% in December.
- The headline PCE rose to 2.6%, beating the 2.5% year-over-year compared to 2.6% in December, while the core PCE is expected rose to 2.6% in January compared to 2.8% in the previous month.
- The Chicago Purchase Managers Index for February is moving up substantially to 45.5, beating the 40.6, expected and coming from 39.5 in January.
- Equities in the US are snapping the losing streak in Asian and European markets with all three major indices sprinting higher this Friday.
- The CME Fedwatch Tool projects a 29.7% chance that interest rates will remain at the current range of 4.25%-4.50% in June, with the rest showing a possible rate cut.
- The US 10-year yield trades around 4.24%, further down from last week’s high at 4.574%.
US Dollar Index Technical Analysis: The weekend to let the dust settle
Finally, the US Dollar Index (DXY) might have had a nice uptick. Holding current ground will be key, with the biggest challenge coming from US yields still trending lower, narrowing the rate differential between the US and other countries. Another leg lower is possible should inflation concerns swirl back and push US yields higher again, supporting a stronger US Dollar.
On the upside, the 55-day Simple Moving Average (SMA) is the first resistance to watch for any rejections, currently at 107.97. In case the DXY can break above the 108.00 round level, 108.50 is coming back in scope.
On the downside, as already mentioned, 107.00 needs to hold as support. Nearby, 106.80 (100-day SMA) and 106.52, as a pivotal level, should act as support and avoid any returns to the lower 106-region.
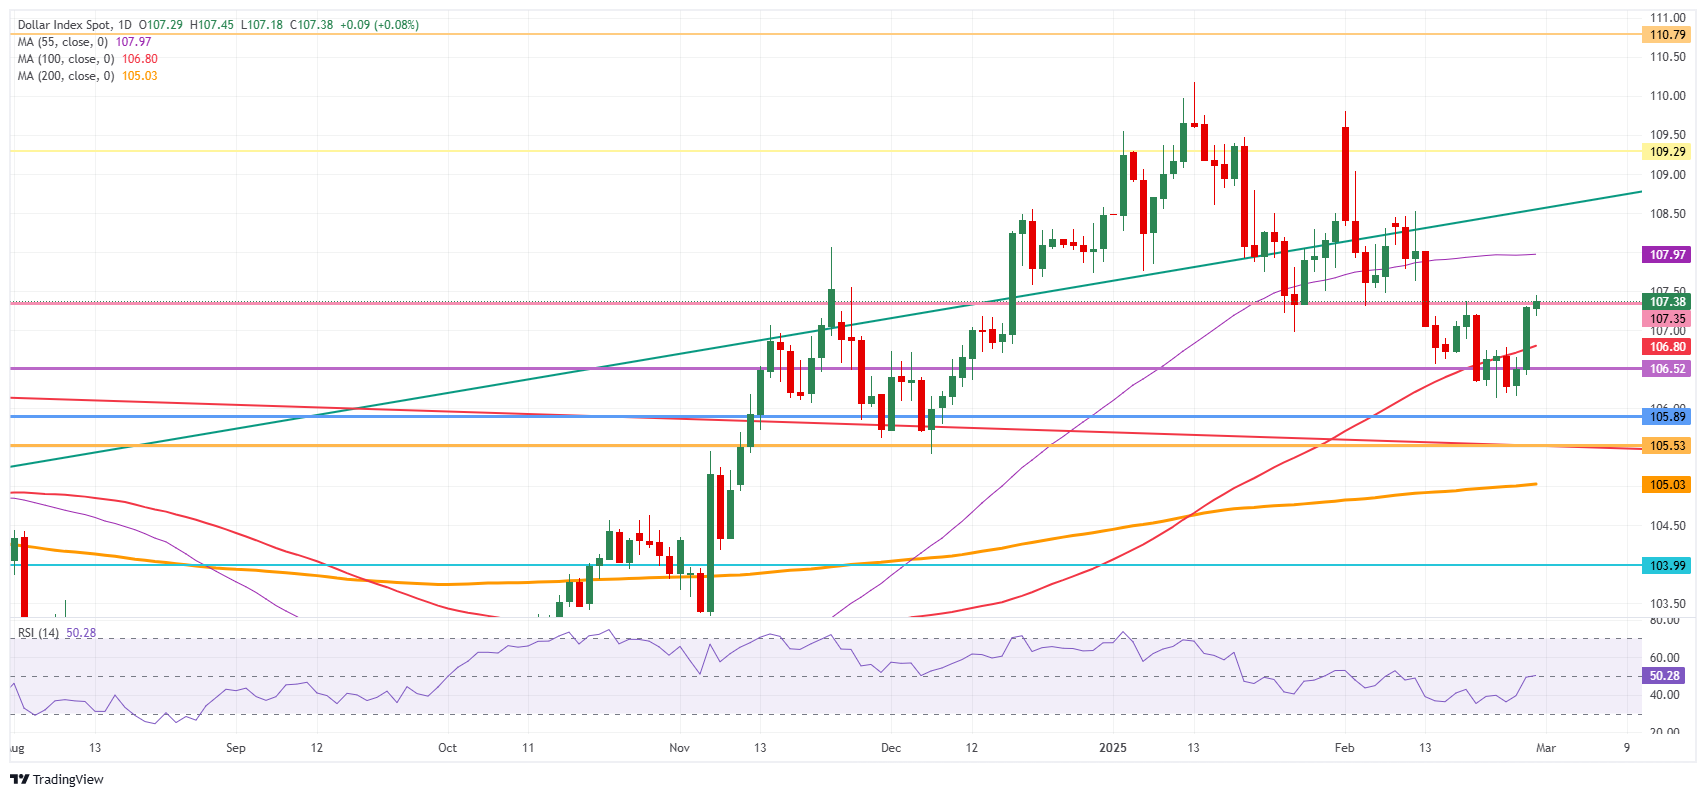
US Dollar Index: Daily Chart
Fed FAQs
Monetary policy in the US is shaped by the Federal Reserve (Fed). The Fed has two mandates: to achieve price stability and foster full employment. Its primary tool to achieve these goals is by adjusting interest rates. When prices are rising too quickly and inflation is above the Fed’s 2% target, it raises interest rates, increasing borrowing costs throughout the economy. This results in a stronger US Dollar (USD) as it makes the US a more attractive place for international investors to park their money. When inflation falls below 2% or the Unemployment Rate is too high, the Fed may lower interest rates to encourage borrowing, which weighs on the Greenback.
The Federal Reserve (Fed) holds eight policy meetings a year, where the Federal Open Market Committee (FOMC) assesses economic conditions and makes monetary policy decisions. The FOMC is attended by twelve Fed officials – the seven members of the Board of Governors, the president of the Federal Reserve Bank of New York, and four of the remaining eleven regional Reserve Bank presidents, who serve one-year terms on a rotating basis.
In extreme situations, the Federal Reserve may resort to a policy named Quantitative Easing (QE). QE is the process by which the Fed substantially increases the flow of credit in a stuck financial system. It is a non-standard policy measure used during crises or when inflation is extremely low. It was the Fed’s weapon of choice during the Great Financial Crisis in 2008. It involves the Fed printing more Dollars and using them to buy high grade bonds from financial institutions. QE usually weakens the US Dollar.
Quantitative tightening (QT) is the reverse process of QE, whereby the Federal Reserve stops buying bonds from financial institutions and does not reinvest the principal from the bonds it holds maturing, to purchase new bonds. It is usually positive for the value of the US Dollar.
Author

Filip Lagaart
FXStreet
Filip Lagaart is a former sales/trader with over 15 years of financial markets expertise under its belt.

















