US Dollar flat and steady while equity rout sees Nasdaq plunge over 2%
- Bond prices spike, US equities plunge and Gold surges to new all-time high ahead of Trump’s tariffs.
- US President Trump confirmed on Sunday at Airforce One that all countries will be hit.
- The US Dollar Index trades stable around 104.10, with no safe-haven flows in the Greenback.

The US Dollar Index (DXY), which tracks the performance of the US Dollar (USD) against six major currencies, is still stuck and does not see any substantial moves while other asset classes in markets are facing mayhem. The DXY is completely left in the dark while Equities are selling off, Bond prices are spiking higher, and Gold has hit a fresh all-time high above $3,100 earlier in the day. The move comes after United States (US) President Donald Trump reiterated on Sunday at Airforce One that all countries will fall under reciprocal tariffs on Wednesday's 'Liberation Day', Bloomberg reports.
One thing that became clear last week is that the US Dollar (USD) is moving depending on US economic data, and fears of stagflation or recession are weakening the Greenback. Thus, Monday's focus will shift to March’s Chicago Purchase Manager’s Index and the Dallas Fed Manufacturing Business Index. Contractions and slow downs in those economic data points could trigger another leg lower in the DXY.
Daily digest market movers: Nothing to see here
- The Chicago Purchase Manager’s Index (PMI) has seen an uptick to 47.6, beating the estimate of 45.4, and above the previous 45.5. The number remains in contraction though.
- At 14:30 GMT, the Dallas Federal Reserve (Fed) will release the Manufacturing Business Index for March. No forecast is available, with the previous reading at -8.3.
- Equities are diving lower with losses between 1.0% to 2.0% crossing from Asia over Europe and into US futures. The Nasdaq is leading the decline, down over 2%.
- According to the CME Fedwatch Tool, the probability of interest rates remaining at the current range of 4.25%-4.50% in May’s meeting is 82.1%. For June’s meeting, the odds for borrowing costs being lower stand at 81.2%.
- The US 10-year yield trades around 4.22%, a substantial drop lower and the reason why the Fedwatch Tool sees elevated chances for a rate cut in June.
US Dollar Index Technical Analysis: Where are we?
The US Dollar Index (DXY) provided an answer last week and this Monday to one question that was on traders’ minds. Tariffs clearly do not impact the US Dollar. Instead, the US economic data looks to be impacting the Greenback, as seen on Friday with the University of Michigan Consumer Sentiment and elevated inflation expectations reading, which pushed the US Dollar lower. The recession or stagflation fear no longer supports a stronger US Dollar, and more evidence of stagflation could push the DXY lower from here.
A return to the 105.00 round level could still occur in the coming days, with the 200-day Simple Moving Average (SMA) converging at that point and reinforcing this area as a strong resistance at 104.94. Once broken through that zone, a string of pivotal levels, such as 105.53 and 105.89, could limit the upward momentum.
On the downside, the 104.00 round level is the first nearby support, although it looks bleak after being tested on Friday and again this Monday. If that level does not hold, the DXY risks falling back into that March range between 104.00 and 103.00. Once the lower end at 103.00 gives way, watch out for 101.90 on the downside.
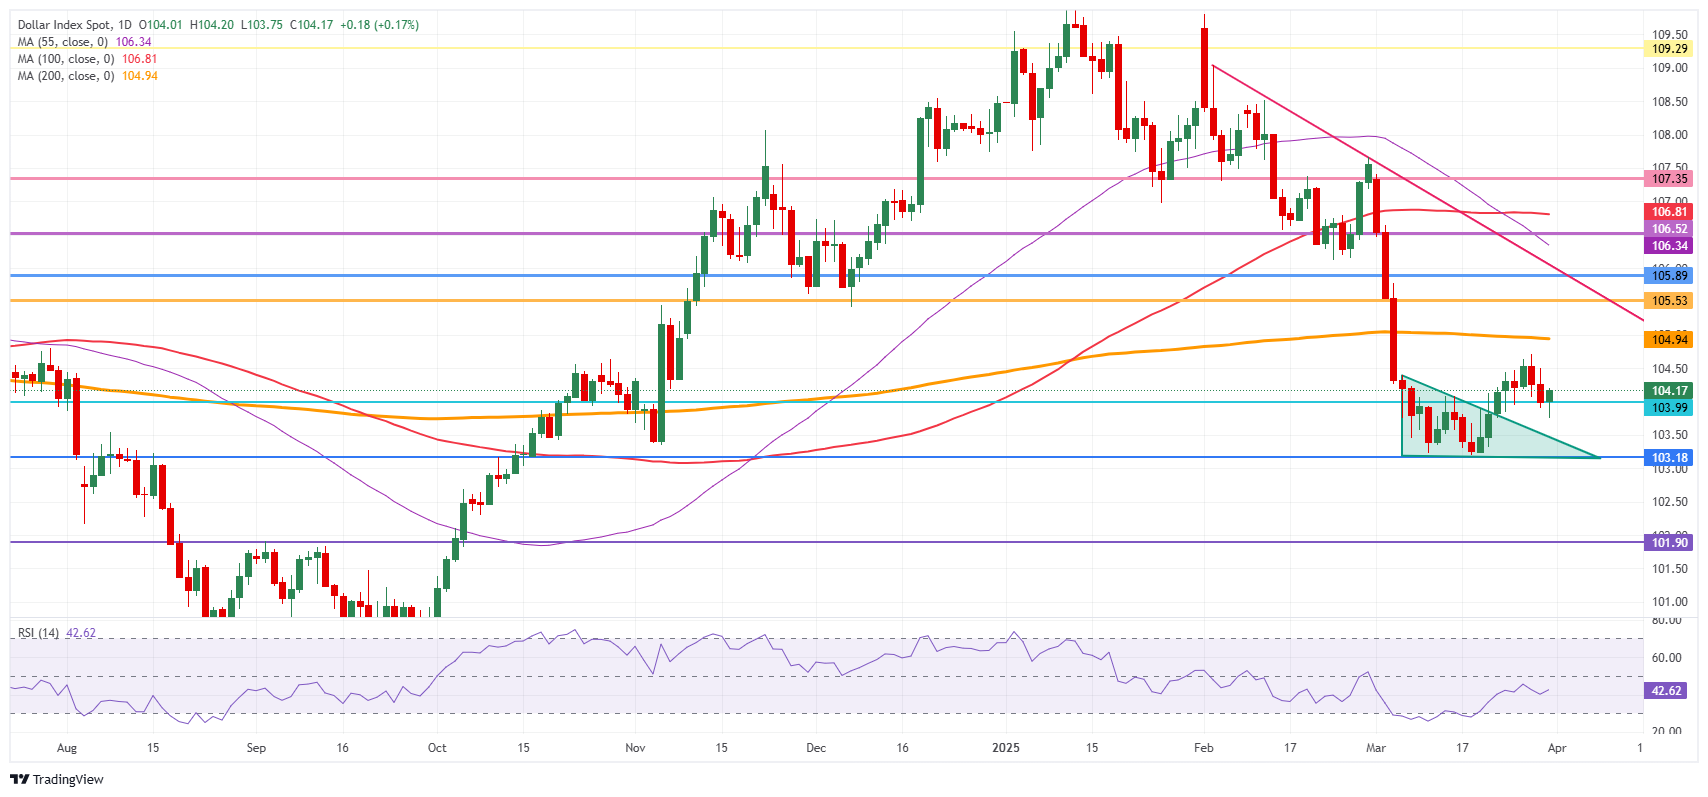
US Dollar Index: Daily Chart
Inflation FAQs
Inflation measures the rise in the price of a representative basket of goods and services. Headline inflation is usually expressed as a percentage change on a month-on-month (MoM) and year-on-year (YoY) basis. Core inflation excludes more volatile elements such as food and fuel which can fluctuate because of geopolitical and seasonal factors. Core inflation is the figure economists focus on and is the level targeted by central banks, which are mandated to keep inflation at a manageable level, usually around 2%.
The Consumer Price Index (CPI) measures the change in prices of a basket of goods and services over a period of time. It is usually expressed as a percentage change on a month-on-month (MoM) and year-on-year (YoY) basis. Core CPI is the figure targeted by central banks as it excludes volatile food and fuel inputs. When Core CPI rises above 2% it usually results in higher interest rates and vice versa when it falls below 2%. Since higher interest rates are positive for a currency, higher inflation usually results in a stronger currency. The opposite is true when inflation falls.
Although it may seem counter-intuitive, high inflation in a country pushes up the value of its currency and vice versa for lower inflation. This is because the central bank will normally raise interest rates to combat the higher inflation, which attract more global capital inflows from investors looking for a lucrative place to park their money.
Formerly, Gold was the asset investors turned to in times of high inflation because it preserved its value, and whilst investors will often still buy Gold for its safe-haven properties in times of extreme market turmoil, this is not the case most of the time. This is because when inflation is high, central banks will put up interest rates to combat it. Higher interest rates are negative for Gold because they increase the opportunity-cost of holding Gold vis-a-vis an interest-bearing asset or placing the money in a cash deposit account. On the flipside, lower inflation tends to be positive for Gold as it brings interest rates down, making the bright metal a more viable investment alternative.
BRANDED CONTENT
Choosing a broker that aligns with your trading needs can significantly impact performance. Our list of the best regulated brokers highlights the best options for seamless and cost-effective trading.
Author

Filip Lagaart
FXStreet
Filip Lagaart is a former sales/trader with over 15 years of financial markets expertise under its belt.


