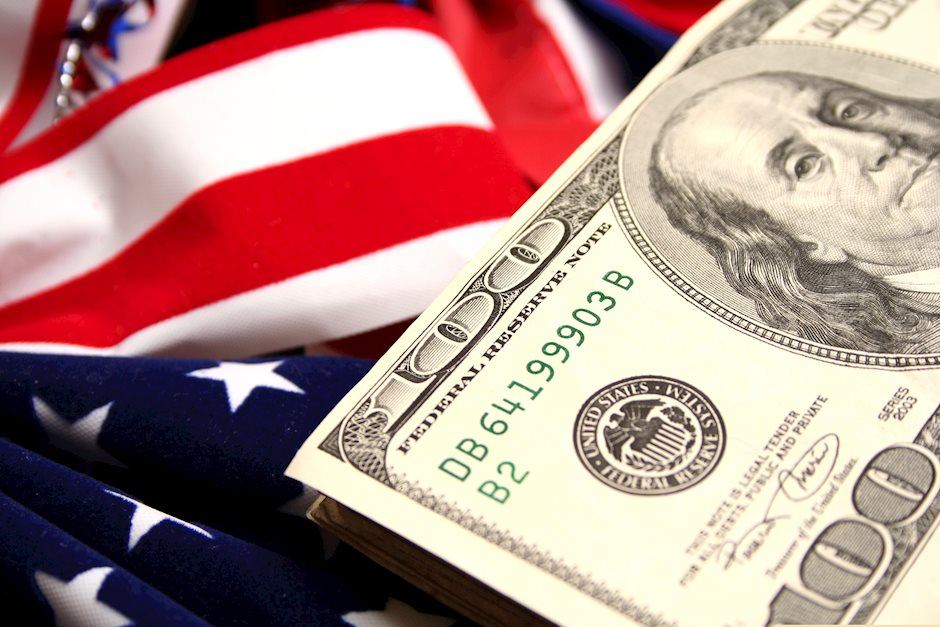
US Dollar faces pressure as Israel ground offensive gets delayed
- The Greenback slid lower last week despite steady safe-haven demand.
- Geopolitics and a very packed data calendar will be the driving force for the US Dollar this week. .
- The US Dollar Index closed out its week in the red, going nowhere in October.
The US Dollar (USD) is facing headwinds as it looks that its months-long rally has officially halted. From a pure technical point of view, the weekly chart of the US Dollar Index (DXY) shows that the US Dollar Index has been trading sideways for the last three weeks. According to the Wyckoff Trading philosophy, the US Dollar Index is in a distribution phase ahead of either a substantial leg higher or lower.
On the economic data front, traders will have a light Monday ahead of other data points later this week. The focal point will be on Thursday, when the US Gross Domestic Product (GDP) numbers for the third quarter are due to come out. On Friday, the Federal Reserve preferred inflation gauge will be published: the Personal Consumption Expenditures Price Index.
Daily digest: US Dollar between a rock and a hard place
- The delay of the Israeli ground offensive is holding markets in a choke hold as investors could see a risk premium being factored in for yet a proxy war to develop.
- One data point for this Monday at 12:30 GMT is the Chicago Fed National Activity Index for September. Previous print was at -0.16.
- The US Treasury is heading to the markets again with a 3-month and a 6-month bill auction at 15:30 GMT.
- Equities are starting the week in the red. Asian indexes fall by near 1% and European equities are down around 0.50%. US equity futures are looking for direction ahead of a new week of earnings.
- The CME Group’s FedWatch Tool shows that markets are pricing in a 98.4% chance that the Federal Reserve will keep interest rates unchanged at its meeting in November.
- The benchmark 10-year US Treasury yield trades at 4.98%, just a sigh away from 4.99%, the multi-year high. The bond market is still stuck in a sellers market, where higher yields are demanded before buying US bonds.
US Dollar Index technical analysis: Going nowhere
The US Dollar dropped the ball last week and closed in the red, proving to the second-guessers that the DXY summer rally is behind us. For October, the Greenback has not really moved that much and despite geopolitical tensions, more convictions are starting to build in the market that the US Dollar might rather go down. All eyes will be on the 106.00 level, which could start to see substantial breakthroughs to the downside if US economic data start to deteriorate.
Should the DXY want to deliver a bullish signal, at least the high of last week at 106.67 needs to be broken. Preferably a re-enter above the summer rally trend line would support further upside moves. On the topside, 107.19 is an important level to reach. If this is the case, 109.30 is the next level to watch.
On the downside, the recent resistance at 105.88 did not do a good job supporting any downturn. Instead, look for 105.12 to keep the DXY above 105.00. If that fails to do the trick, 104.33 will be the best level to look for resurgence in US Dollar strength, as it aligns with the 55-day Simple Moving Average (SMA) as a support level.
US Dollar FAQs
What is the US Dollar?
The US Dollar (USD) is the official currency of the United States of America, and the ‘de facto’ currency of a significant number of other countries where it is found in circulation alongside local notes. It is the most heavily traded currency in the world, accounting for over 88% of all global foreign exchange turnover, or an average of $6.6 trillion in transactions per day, according to data from 2022.
Following the second world war, the USD took over from the British Pound as the world’s reserve currency. For most of its history, the US Dollar was backed by Gold, until the Bretton Woods Agreement in 1971 when the Gold Standard went away.
How do the decisions of the Federal Reserve impact the US Dollar?
The most important single factor impacting on the value of the US Dollar is monetary policy, which is shaped by the Federal Reserve (Fed). The Fed has two mandates: to achieve price stability (control inflation) and foster full employment. Its primary tool to achieve these two goals is by adjusting interest rates.
When prices are rising too quickly and inflation is above the Fed’s 2% target, the Fed will raise rates, which helps the USD value. When inflation falls below 2% or the Unemployment Rate is too high, the Fed may lower interest rates, which weighs on the Greenback.
What is Quantitative Easing and how does it influence the US Dollar?
In extreme situations, the Federal Reserve can also print more Dollars and enact quantitative easing (QE). QE is the process by which the Fed substantially increases the flow of credit in a stuck financial system.
It is a non-standard policy measure used when credit has dried up because banks will not lend to each other (out of the fear of counterparty default). It is a last resort when simply lowering interest rates is unlikely to achieve the necessary result. It was the Fed’s weapon of choice to combat the credit crunch that occurred during the Great Financial Crisis in 2008. It involves the Fed printing more Dollars and using them to buy US government bonds predominantly from financial institutions. QE usually leads to a weaker US Dollar.
What is Quantitative Tightening and how does it influence the US Dollar?
Quantitative tightening (QT) is the reverse process whereby the Federal Reserve stops buying bonds from financial institutions and does not reinvest the principal from the bonds it holds maturing in new purchases. It is usually positive for the US Dollar.
Author

Filip Lagaart
FXStreet
Filip Lagaart is a former sales/trader with over 15 years of financial markets expertise under its belt.


