The NVDA earnings effect and what it means for the current market momentum [Video]
![The NVDA earnings effect and what it means for the current market momentum [Video]](https://editorial.fxstreet.com/images/Markets/Equities/SP500/wall_street_nyse2-637299021353183737.jpg)
Watch the video extracted from the WLGC session before the market open on 27 Feb 2024 below to find out the following:
-
Discover the 2 key support zones crucial for determining market trends and potential corrections
-
The confluence zone that will make or break the S&P 500.
-
The preliminary supply (early distribution) you need to be aware of.
-
and a lot more...
Market Environment
The bullish vs. bearish setup is 728 to 68 from the screenshot of my stock screener below.
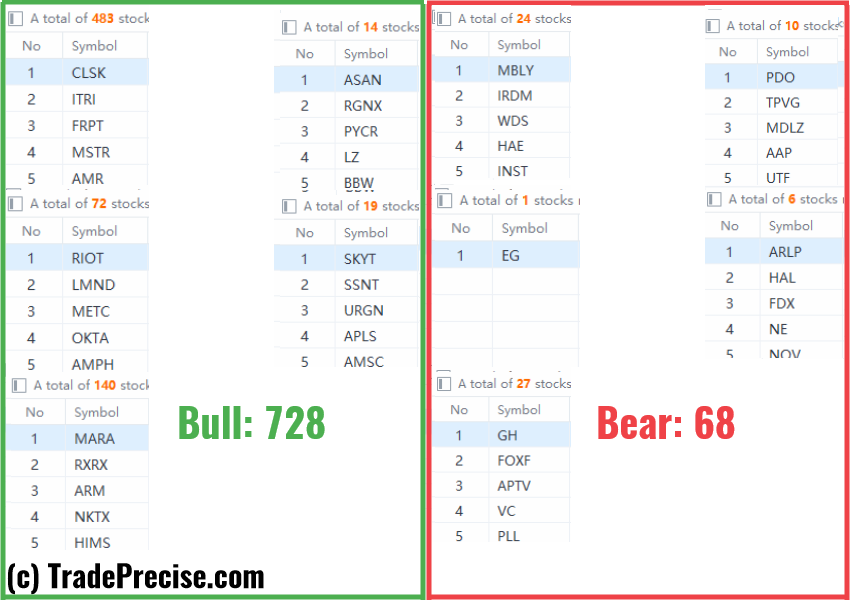
The market again is back to complacency mode as reflected in the numbers of the bullish setup above.
So far, the preliminary supply showed up previously and the market is overextended and overbought. However, as long as the confluence zone as discussed in the video is holding up, there is no confirmation for a market pullback.
Most importantly, lots of the trade entry setups are working.
10 “low-hanging fruits” (CLF, SHAK, etc…) trade entries setup + 19 actionable setups (INBX etc…) plus 4 “wait and hold” candidates have been discussed during the live session before the market open (BMO).
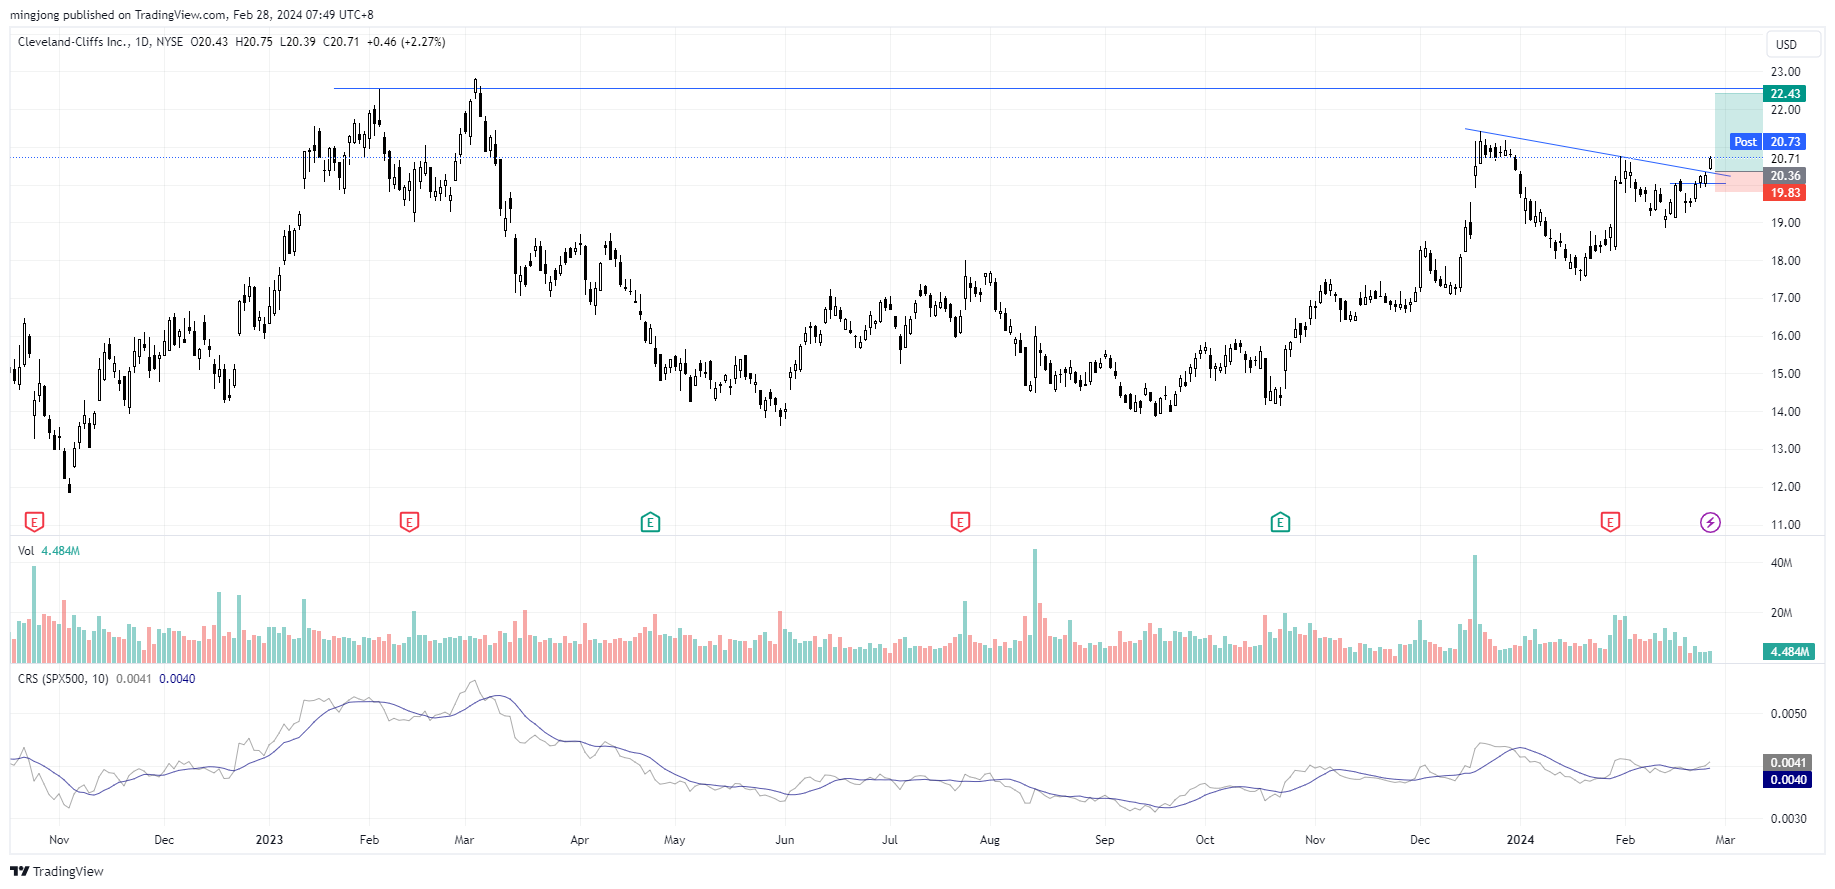
CLF
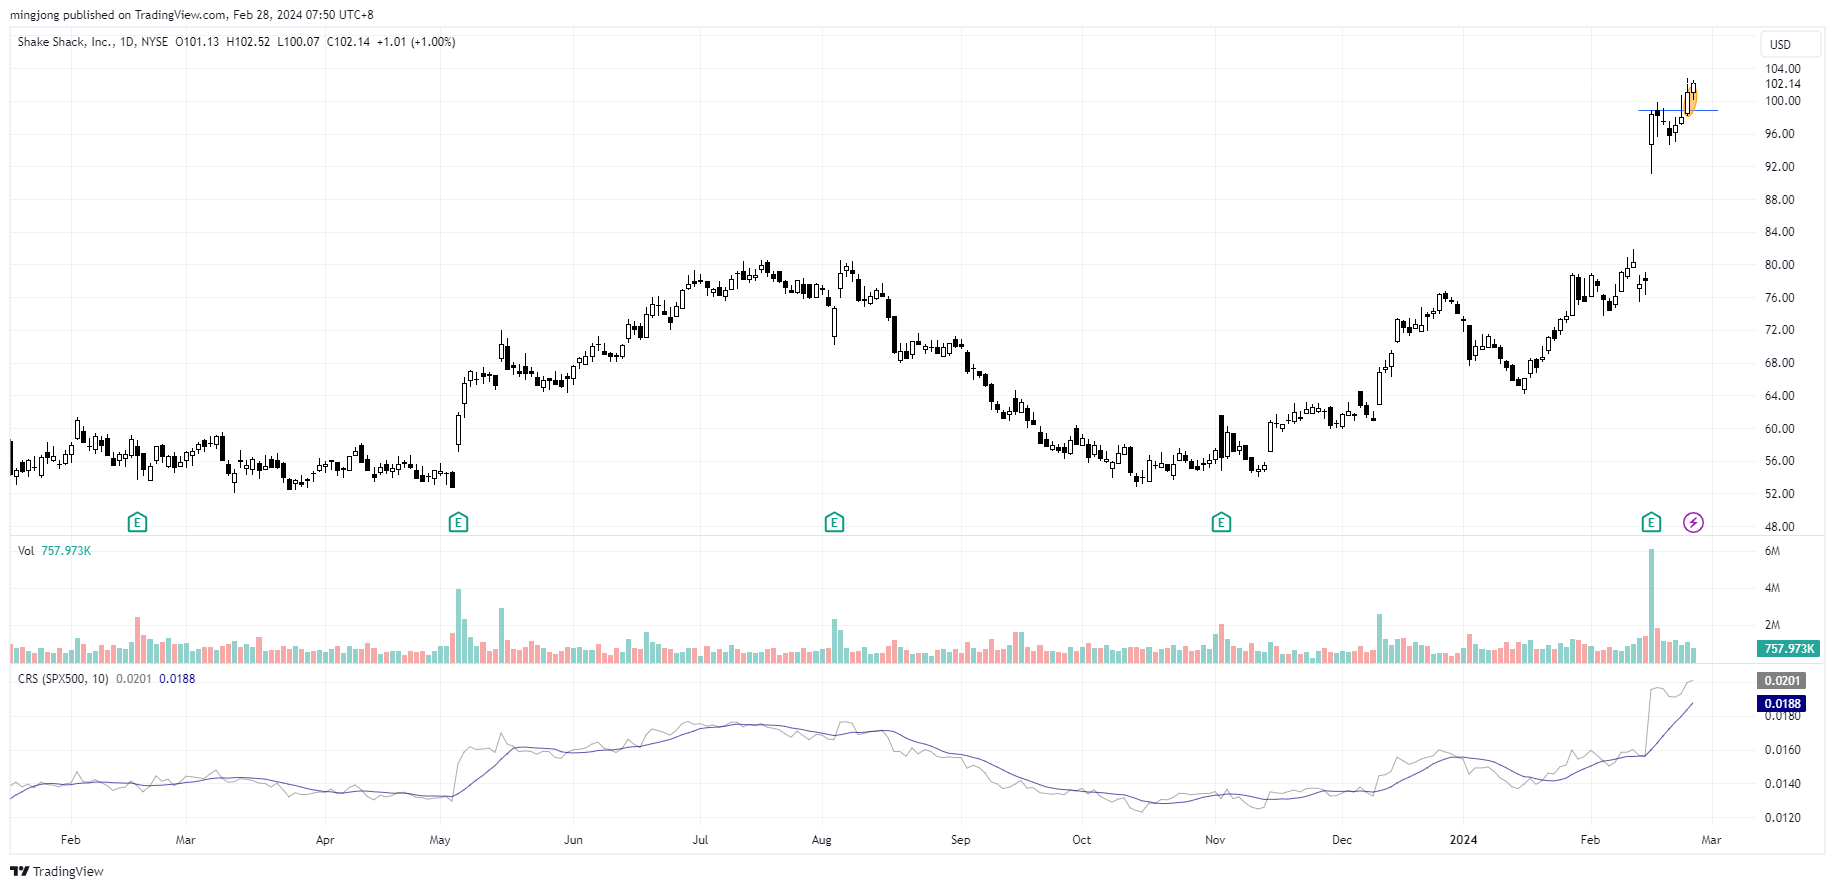
SHAK
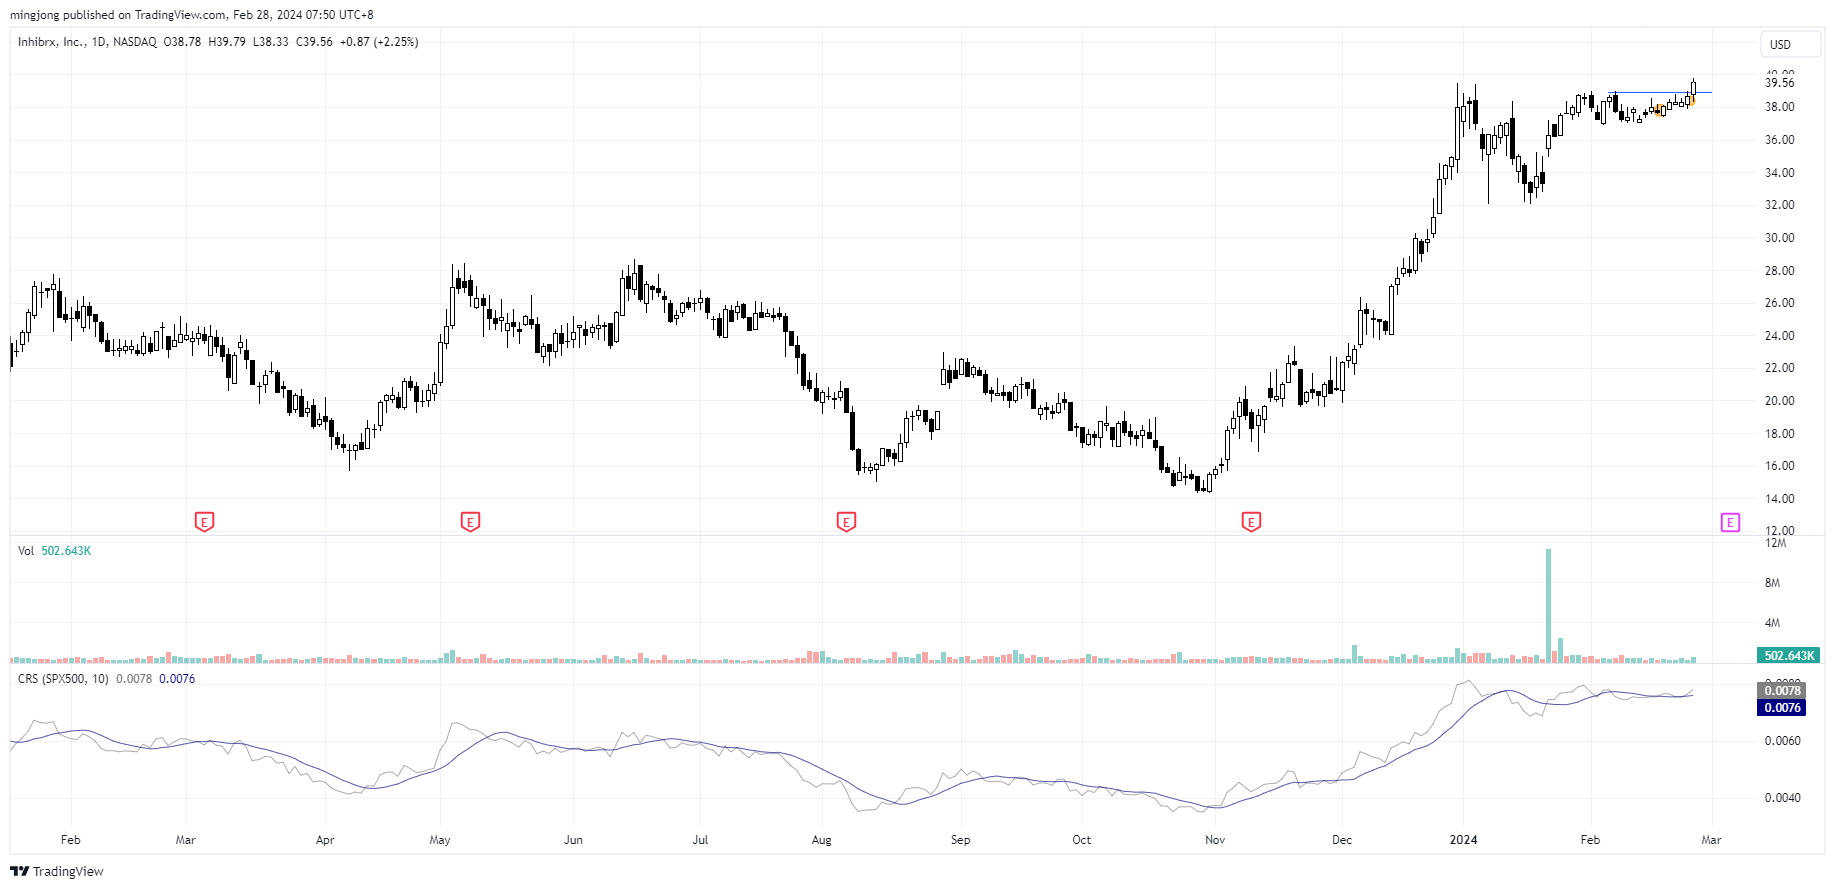
INBX
Author

Ming Jong Tey
Independent Analyst
Ming Jong Tey has been trading since 2008. He started his learning journey from technical analysis (indicators, Fibonacci, etc...) to value investing. Throughout his journey, he develops an interest in price action with chart pattern trading.


