Tesla (TSLA) Stock Price and Forecast: Tesla suffers one of the biggest falls in history
- Tesla stock collapses by over 11% on Tuesday.
- TSLA shares under pressure after Elon Musk tweets about selling.
- TSLA loses $140 billion in market cap on Tuesday.

A huge collapse in the share price of Tesla makes it possibly the largest one-day loss in market cap ever. Meta (FB), formerly Facebook, has had a few large losses as have other mega tech names like Apple (AAPL), but from our brief look through the numbers, we cannot see a greater single-day loss of market cap than this one yesterday. Admittedly, it has to do with Tesla's (TSLA) enormous valuation, making a fall of 11% huge in real numbers. While 11% is a hefty fall anyway in percentage terms, there has been a lot worse.
Tesla closed Tuesday at $1023.50 for a loss of 11.99%.
-637721359238180268.png)
Tesla graph 15 minute
Tesla (TSLA) stock news
The move is now well established as Elon Musk had tweeted about selling 10% of his holding. Given he is the founder and CEO, this is a significant amount. Even noted Tesla bull Ross Gerber said, "We do feel the stock has moved up substantially in the short term and is probably over-valued by about 20 percent so... for long term investors this isn’t a bad time to rebalance by any means."-Reuters. Some recent selling by insiders also will have been noted. Elon Musk's brother Kimbal filed to sell nearly $100 million worth of stock, adding to recent sales by board member Ira Ehrenpreis and former board member Antonio Gracias. Kimbal Musk also donated 25,000 Tesla shares to charity.
Tesla (TSLA) stock forecast
Now the chart looks ugly, very ugly. Even with a loss like the one on Monday, the stock is still well ahead for 2021. Tesla (TSLA) is still outperforming the indices as it is ahead by 45% year to date and 150% from this time last year. The move on Monday retraced to the 21-day moving average. Resistance is now at the 9-day MA at $1,120, but given the uncertainty around the proposed share sale by Elon Musk, Tesla is unlikely to bounce this far. Tesla just about held the key psychological level of $1,000, and it will surely look to test that support this week.
We had been warnings that the stock was hugely overbought with a Relative Strength Index (RSI) reading over 90. Now that this has corrected, the RSI is back in neutral. The Moving Average Convergence Divergence (MACD) is about to cross into a bearish signal. The trend is now bearish for the short and medium term and means all bounces should be looked at as selling opportunites. Please always use stops.
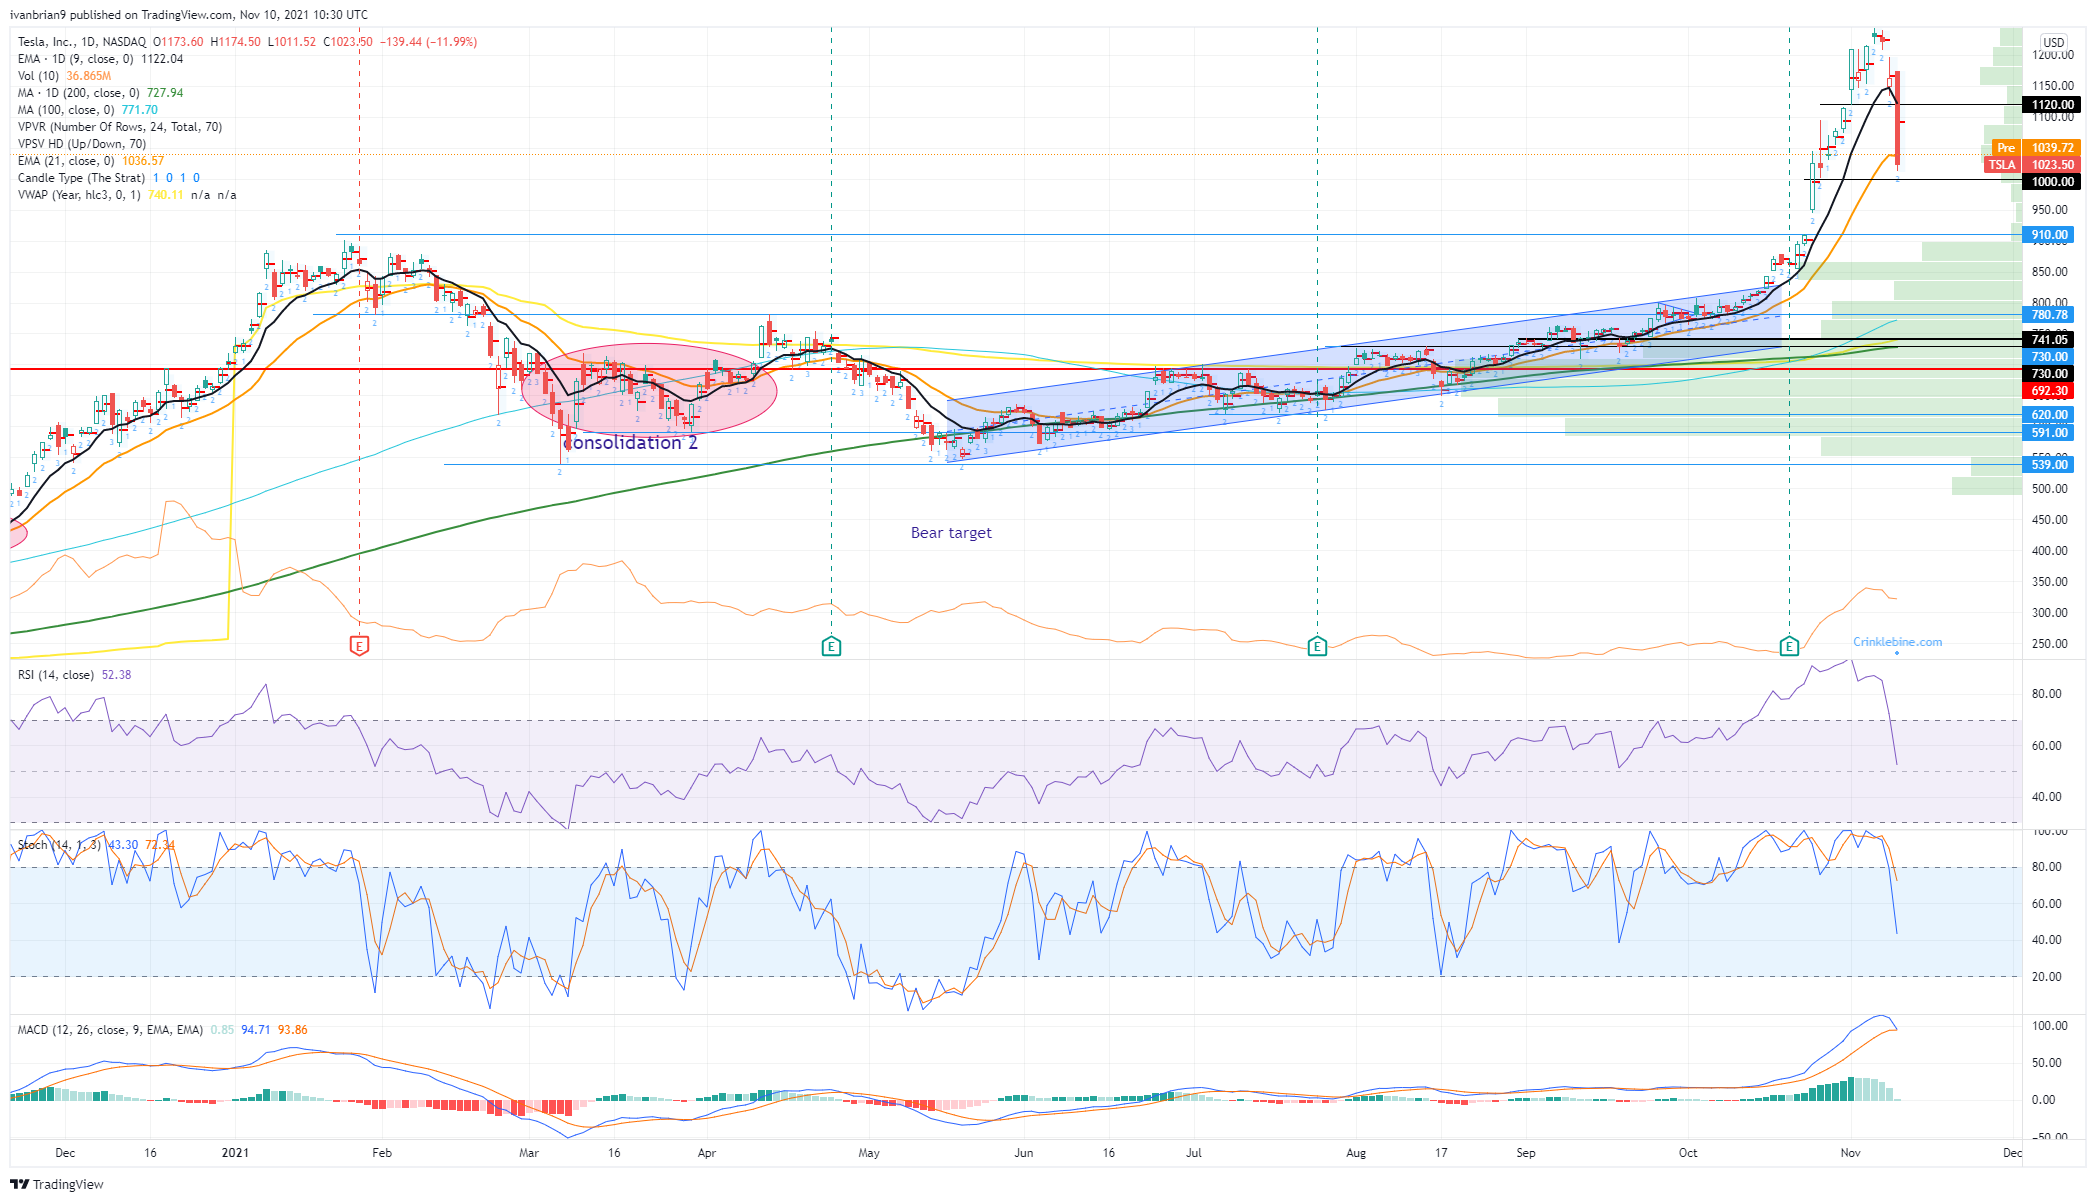
TSLA 1-day chart
Author

Ivan Brian
FXStreet
Ivan Brian started his career with AIB Bank in corporate finance and then worked for seven years at Baxter. He started as a macro analyst before becoming Head of Research and then CFO.


