Telus Corporation (TU) trapped between resistance layers: Can bulls break free?

Telus Corporation (TU) is trading at $12.99 after shedding another 0.70% today, and the Canadian telecom giant finds itself in a technical predicament that's been years in the making. This isn't just a bad week or month—TU has been grinding lower since late 2022, and the chart reveals a stock caught between multiple layers of resistance that have proven stubbornly difficult to overcome.
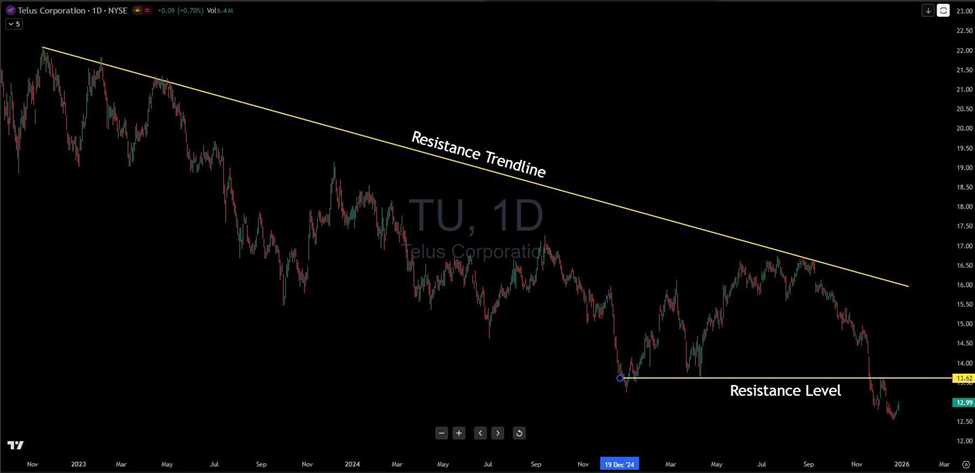
The big picture tells a sobering story. That descending yellow trendline stretching back to the November 2022 peak around $22 has been an unforgiving ceiling, rejecting every meaningful rally attempt for over two years. Each time bulls tried to mount a comeback, sellers emerged at this resistance, methodically pushing price lower in a pattern that's defined the entire downtrend. Currently sitting around $16, this trendline remains a distant target for any serious reversal scenario.
But there's a more immediate resistance that's giving bulls headaches right now. Notice that horizontal yellow line at $13.62? That level has become the line in the sand for this stock. Multiple tests throughout late 2024 have all ended the same way—price approaches, gets rejected, and pulls back. The December 19th attempt, marked on the chart, looked promising for a moment before sellers stepped in once again. That's the definition of resistance doing its job.
What makes this setup particularly challenging for bulls is the double-barrel resistance structure. Even if TU manages to clear $13.62, there's still that descending trendline waiting overhead. Breaking one resistance is hard enough; breaking through two in succession requires sustained buying pressure and a fundamental catalyst that simply hasn't materialized yet.
The bearish case is straightforward: this is a stock in a confirmed downtrend, failing at resistance, with momentum pointing lower. If $12.50 gives way, the path toward $12.00 and potentially $11.50 opens up quickly. For bears, the strategy is simple—wait for failed breakout attempts at $13.62 and ride the rejection lower.
Bulls need a different playbook entirely. Any long position here is speculative until TU can prove it's changed character by clearing $13.62 with conviction and volume. That would be step one. Step two requires tackling that descending trendline, which won't be easy given its multi-year track record of containing price.
The reality is that TU is stuck in no-man's-land, battling resistance layers that have held firm for months. Until something breaks—either resistance overhead or support beneath—this stock is more likely to chop than trend.
Author

Benjamin Pool
Verified Investing
A seasoned financial expert with a passion for empowering individuals to mastering smart money management.


