Technical analysis: Will the S&P 500 quotes continue to decline?

S&P 500 Index technical analysis summary
Above 3825
Buy Stop
Below 4325
Stop Loss
| Indicator | Signal |
| RSI | Neutral |
| MACD | Sell |
| MA(200) | Neutral |
| Fractals | Sell |
| Parabolic SAR | Sell |
| Bollinger Bands | Neutral |
S&P 500 Index chart analysis
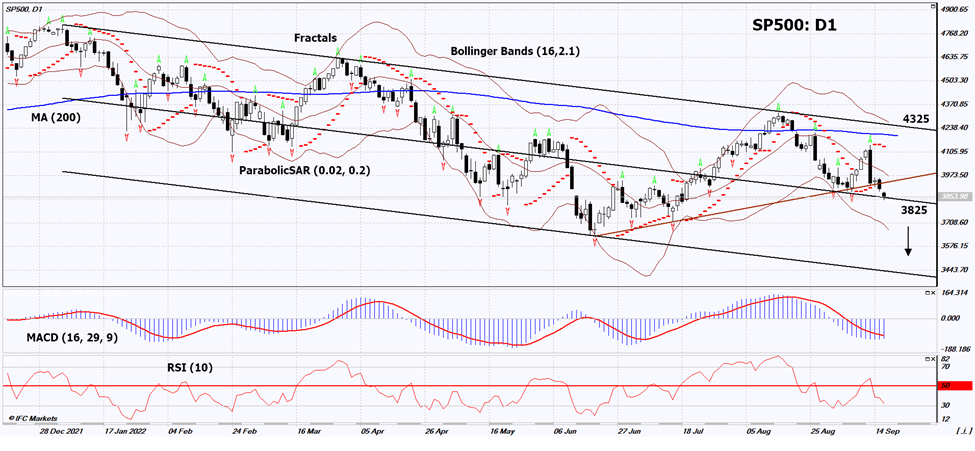
On the daily timeframe, SP500: D1 keeps the medium-term down channel. It broke down the support line of the short-term uptrend. A number of technical analysis indicators formed signals for further decline. We do not rule out a bearish movement if SP500: D1 falls below its most recent low: 3825. This level can be used as an entry point. The initial risk limit is possible above the last 4 upper fractals, the upper Bollinger band, the 200-day moving average line and the Parabolic signal: 4325. After opening a pending order, we move the stop following the Bollinger and Parabolic signals to the next fractal low. Thus, we change the potential profit/loss ratio in our favor. The most cautious traders, after making a trade, can switch to a four-hour chart and set a stop loss, moving it in the direction of movement. If the price overcomes the stop level (4325) without activating the order (3825), it is recommended to delete the order: there are internal changes in the market that were not taken into account.
Fundamental analysis of Indices - S&P 500 Index
A Fed rate hike could help correct the stock market. Will the SP500 quotes continue to decline?
The next meeting of the Fed will take place on September 21, Wednesday. According to CME FedWatch, with a probability of 84% the rate will be increased by 0.75% and with a probability of 16% - immediately by 1%. Now it is 2.5%. Higher rates could increase corporate leverage. In addition, it boosts the yields of bonds, which usually compete with stocks for investors' money. The US 10 Year Treasury yield is now approaching 3.5% per annum. An additional negative for the US stock market may be the opinion of the World Bank that in 2023 the global economy may face a recession. In other words, there is a risk that global GDP will contract by 0.4% if global core inflation rises twice the 5-year average or up to 5% y/y (excluding energy prices). At the same time, the World Bank hopes to maintain a slight global growth at the end of the current year at the level of +0.5%. Recall that in January he predicted global GDP growth in 2022 by 4.1%. In 2021, global GDP increased by 5.7%.
Want to get more free analytics? Open Demo Account now to get daily news and analytical materials.
Want to get more free analytics? Open Demo Account now to get daily news and analytical materials.
Author

Dmitry Lukashov
IFC Markets
Dimtry Lukashov is the senior analyst of IFC Markets. He started his professional career in the financial market as a trader interested in stocks and obligations.


