Technical analysis: Will the Deutsche Telekom (DTE Stock) stock price continue retreating?

Deutsche Telekom AG technical analysis summary
Buy Stop: Above 15.94
Stop Loss: Below 15.14
| Indicator | Signal |
| Stochastic | Buy |
| Fractals | Neutral |
Deutsche Telekom AG chart analysis
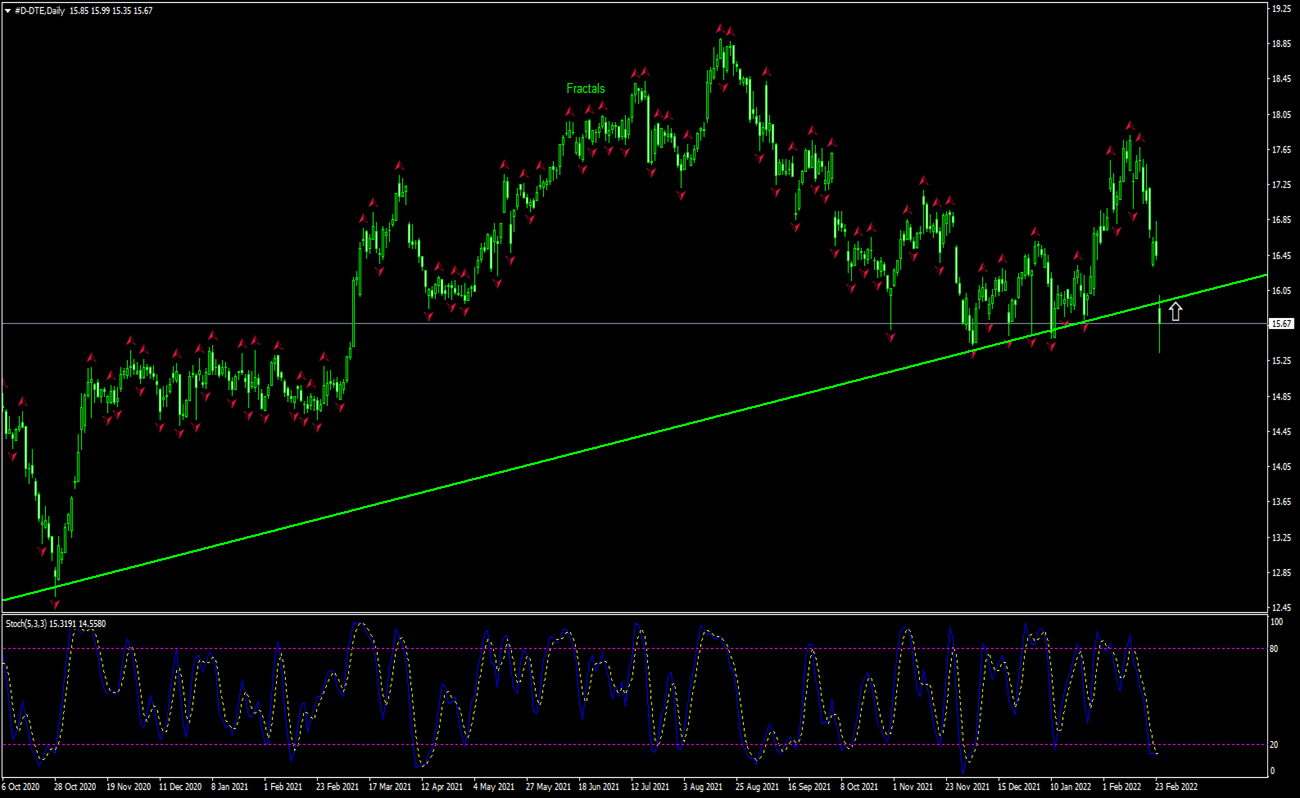
The technical analysis of the Deutsche Telekom stock price chart on daily timeframe shows #D-DTE, Daily is testing the support line. We believe the bullish momentum will resume after the price breaches above the support at 15.94. This level can be used as an entry point for placing a pending order to buy. The stop loss can be placed below 15.14. After placing the order, the stop loss is to be moved every day to the next fractal low indicator. Thus, we are changing the expected profit/loss ratio to the breakeven point. If the price meets the stop loss level (15.14) without reaching the order (15.94), we recommend cancelling the order: the market has undergone internal changes which were not taken into account.
Fundamental analysis of stocks - Deutsche Telekom AG
Deutsche Telekom stock declined while the company reported better than expected results. Will the Deutsche Telekom stock price continue retreating?
Deutsche Telekom AG is a German telecommunication services company. Its market capitalization is €77.7 billion. The stock is trading at P/E ratio (Trailing Twelve Months) of 13.81 currently. Deutsche Telekom earned €110.35 billion revenue (ttm) and Return on Equity (ttm) of 10.59% with Return on Assets (ttm) at 3.57%. Yesterday the company reported quarterly results that beat expectations. Fourth quarter revenue increased by 4.7% to 28.9 billion euros, just above consensus estimates of 28.76 billion euros. Adjusted earnings before interest, tax, depreciation and amortisation after leases were reported at 9 billion euros ($10.1 billion), also above consensus estimates of 8.83 billion euros. Deutsche Telekom reported 53.2 million customers in Germany and 45.8 million in rest of Europe. Higher revenue and earnings are bullish for stock price. However, the stock closed 5.4% lower on Thursday, which can be attributed largely to sentiment hit that Russian invasion of Ukraine caused.
Want to get more free analytics? Open Demo Account now to get daily news and analytical materials.
Want to get more free analytics? Open Demo Account now to get daily news and analytical materials.
Premium
You have reached your limit of 3 free articles for this month.
Start your subscription and get access to all our original articles.
Author

Dmitry Lukashov
IFC Markets
Dimtry Lukashov is the senior analyst of IFC Markets. He started his professional career in the financial market as a trader interested in stocks and obligations.


