Swiss Market Index Elliott Wave technical analysis [Video]
![Swiss Market Index Elliott Wave technical analysis [Video]](https://editorial.fxsstatic.com/images/i/CHF-bearish-line_XtraLarge.png)
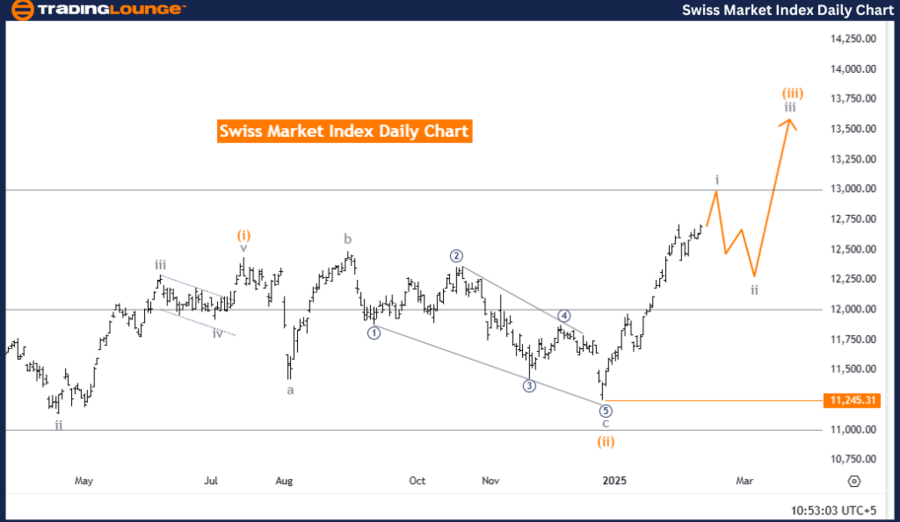
Swiss Market Index – Elliott Wave analysis (day chart).
Swiss Market Index Elliott Wave technical analysis
Technical overview
-
Function: Bullish Trend.
-
Mode: Impulsive.
-
Structure: Gray Wave 1.
-
Position: Orange Wave 3.
-
Direction next lower degrees: Gray Wave 2.
-
Details: Orange Wave 2 completed; now Gray Wave 1 of 3 is in play.
-
Wave cancel invalidation level: 11,245.31.
Market analysis
The Swiss Market Index (SMI) day chart presents a bullish trend with an impulsive wave structure. The active wave is Gray Wave 1, which is part of a broader upward movement. The recent completion of Orange Wave 2 marks the conclusion of a corrective phase, paving the way for a new impulsive wave.
With Gray Wave 1 of 3 now in play, the market enters the early stages of an upward move. This phase typically indicates strong price acceleration, as it represents the first leg of an impulsive trend. The transition from Orange Wave 2 to Gray Wave 1 signals renewed bullish momentum, reinforcing expectations for higher price levels.
Key considerations
-
The next lower-degree wave points toward Gray Wave 2, which is expected to be the next corrective phase once the current wave progresses further.
-
The bullish outlook remains valid as long as the market stays above the invalidation level of 11,245.31.
-
The wave structure suggests that the market is resuming its upward trajectory, with Gray Wave 1 leading the way.
Conclusion
The Swiss Market Index (SMI) day chart confirms a bullish trend within an impulsive wave structure. The market has completed Orange Wave 2 and is now in Gray Wave 1 of 3, indicating the start of a strong upward move.
Traders should monitor price action closely to confirm the continuation of bullish momentum. The key invalidation level at 11,245.31 should be watched carefully to ensure that the uptrend remains intact.
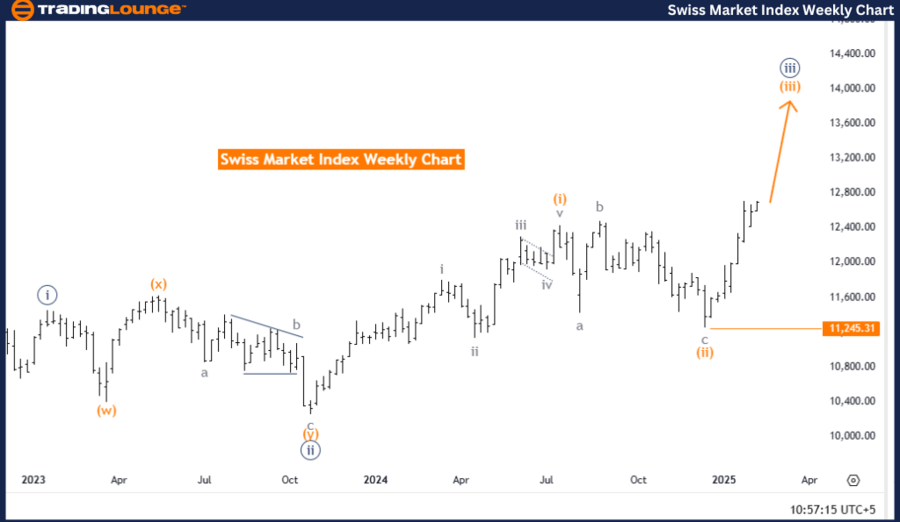
Swiss Market Index – Elliott Wave Analysis (Weekly chart).
Swiss Market Index Elliott Wave technical analysis
Technical overview
-
Function: Bullish Trend.
-
Mode: Impulsive.
-
Structure: Orange Wave 3.
-
Position: Navy Blue Wave 3.
-
Direction next lower degrees: Orange Wave 4.
-
Details: Orange Wave 2 completed; now Orange Wave 3 is in play.
-
Wave cancel invalidation level: 11,245.31.
Market analysis
The Swiss Market Index (SMI) weekly chart indicates a bullish trend within an impulsive wave structure. The active wave is Orange Wave 3, which is part of a broader Navy Blue Wave 3, confirming a strong upward trajectory.
The completion of Orange Wave 2 marks the end of a corrective phase, initiating the new impulsive wave. With Orange Wave 3 now in play, the market enters a key phase of strong price movement, further strengthening bullish momentum. This wave generally indicates continued upward potential, reinforcing a positive market outlook.
Key considerations
-
The next lower-degree wave to monitor is Orange Wave 4, which will likely serve as the next corrective move once Orange Wave 3 progresses further.
-
The bullish trend remains intact as long as the price stays above the invalidation level of 11,245.31.
-
The Elliott Wave structure suggests that the market is in a strong uptrend, with Orange Wave 3 driving the price higher.
Conclusion
The Swiss Market Index (SMI) weekly chart reflects a bullish trend with an impulsive wave structure. The market has completed Orange Wave 2 and is now in Orange Wave 3, signaling strong upward movement.
Traders should closely monitor price action to confirm the continuation of bullish momentum. The key invalidation level at 11,245.31 remains a crucial reference point for maintaining a valid uptrend.
Swiss Market Index Elliott Wave technical analysis [Video]
Author

Peter Mathers
TradingLounge
Peter Mathers started actively trading in 1982. He began his career at Hoei and Shoin, a Japanese futures trading company.


