|

SPX perfectly reacting higher from the blue box area

In this technical blog, we will look at the past performance of the 4-hour Elliott Wave Charts of SPX. We presented to members at the elliottwave-forecast. In which, the rally from the October 2022 low unfolding as an impulse structure. Also showed a higher high sequence with a bullish sequence stamp. Suggested that index should see more upside extension to complete the impulse sequence. Therefore, we advised members not to sell the index & buy the dips in 3, 7, or 11 swings at the blue box areas. We will explain the structure & forecast below:

SPX four-hour Elliott Wave chart from 1.09.2025

Chart

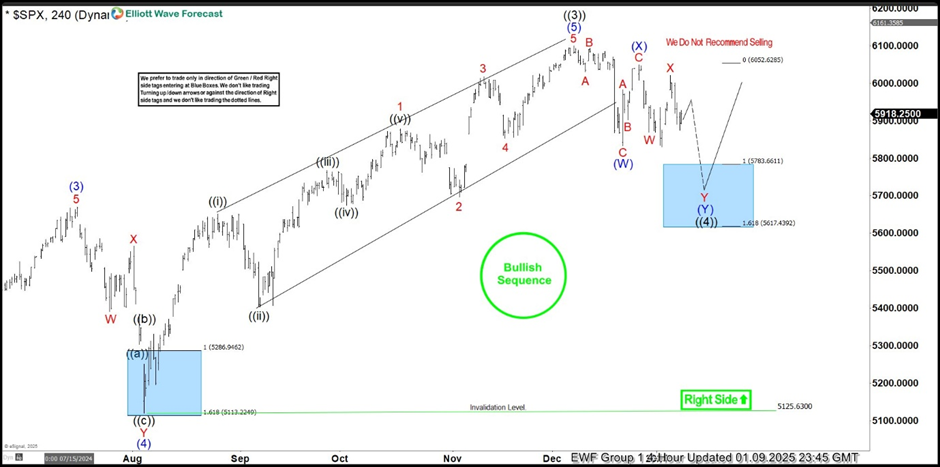
Here’s the 4-hour Elliott wave chart from the 1.09.2025 update. In which, the short-term cycle from the 8.05.2024 low ended impulse sequence & larger wave ((3)) at $6099.97 high. Down from there, the index made a pullback in wave ((4)) to correct that cycle. The internals of that pullback unfolded as Elliott wave double three structure where wave (W) ended at $5832.30 low. Wave (X) bounce ended at $6049.75 high. Then wave (Y) managed to reach the blue box area at $5783.66- $5617.43. From there, buyers were expected to appear looking for the next leg higher or for a 3 wave bounce minimum.

SPX latest four-hour Elliott Wave chart from 1.18.2025

Chart

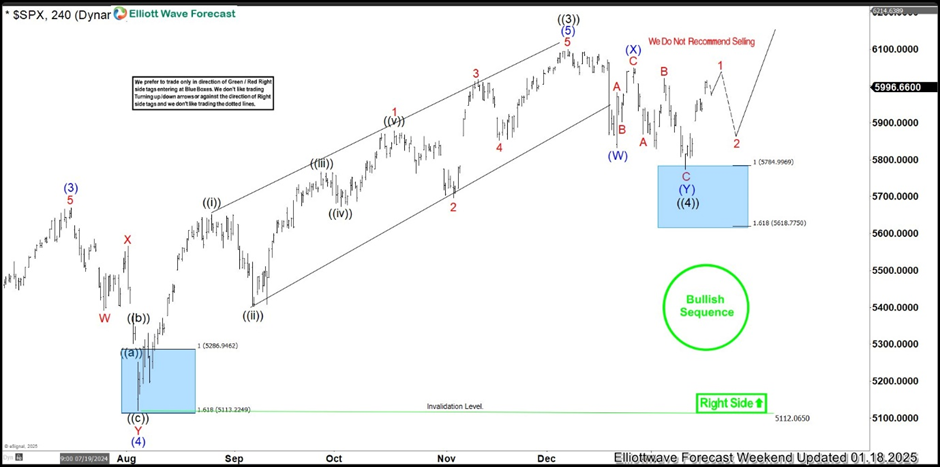
This is the latest 4-hour Elliott wave Chart from the 1.18.2025 Weekend update. In which the SPX is showing a reaction higher taking place, right after ending the double correction within the blue box area. Allowed members to create a risk-free position shortly after taking the long position at the blue box area. However, a break above $6099.97 high is yet to be seen to confirm the next extension higher in wave 5 towards minimum extension target at $6179.13- $6304.44 area.

Author

Elliott Wave Forecast Team

Elliott Wave Forecast Team

ElliottWave-Forecast.com

More from Elliott Wave Forecast Team
Share:

Markets move fast. We move first.

Orange Juice Newsletter brings you expert driven insights - not headlines. Every day on your inbox.

By subscribing you agree to our Terms and conditions.

Editor's Picks

EUR/USD recovers to 1.1750 region as 2025 draws to a close

Following the bearish action seen in the European session on Wednesday, EUR/USD regains its traction and recovery to the 1.1750 region. Nevertheless, the pair's volatility remains low as trading conditions thin out on the last day of the year.

GBP/USD stays weak near 1.3450 on modest USD recovery

GBP/USD remains under modest beairsh pressure and fluctuates at around 1.3450 on Wednesday. The US Dollar finds fresh demand due to the end-of-the-year position adjustments, weighing on the pair amid the pre-New Year trading lull. 

Gold retreats to $4,300 area, looks to post monthly gains

Gold stays on the back foot on the last day of 2025 and trades near $4,300, possibly pressured by profit-taking and position adjustments. Nevertheless, XAU/USD remains on track to post gains for December and extend its winning streak into a fifth consecutive month.

Bitcoin, Ethereum and XRP prepare for a potential New Year rebound

Bitcoin, Ethereum, and Ripple are holding steady on Wednesday after recording minor gains on the previous day. Technically, Bitcoin could extend gains within a triangle pattern while Ethereum and Ripple face critical overhead resistance. 

Economic outlook 2026-2027 in advanced countries: Solidity test

After a year marked by global economic resilience and ending on a note of optimism, 2026 looks promising and could be a year of solid economic performance. In our baseline scenario, we expect most of the supportive factors at work in 2025 to continue to play a role in 2026.

Crypto market outlook for 2026

Year 2025 was volatile, as crypto often is.  Among positive catalysts were favourable regulatory changes in the U.S., rise of Digital Asset Treasuries (DAT), adoption of AI and tokenization of Real-World-Assets (RWA).