|

SPX Elliott Wave: Diagonal formation in progress [Video]

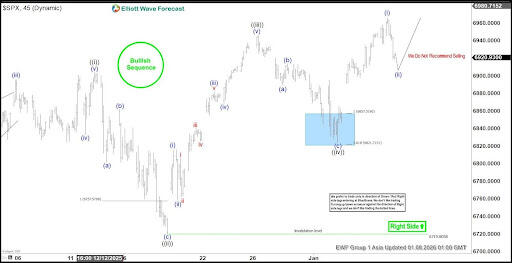
The short-term sequence of the S&P 500 (SPX) from the November 21, 2025 low reveals a diagonal Elliott Wave structure currently unfolding. A diagonal is characterized by five waves, with the distinctive feature of overlapping between waves one and four. From the November 21 low, wave ((i)) advanced to 6903.46, followed by a corrective pullback in wave ((ii)) that concluded at 6719.8. The Index then resumed its upward trajectory in wave ((iii)), which subdivided into an impulsive structure. Within this advance, wave (i) terminated at 6815.19, while wave (ii) dipped to 6758.5. Momentum strengthened as wave (iii) extended higher, reaching 6882.03, before a modest retracement in wave (iv) ended at 6868.81.

The final leg, wave (v), carried the Index to 6945.77, completing wave ((iii)). A corrective phase then emerged in wave ((iv)), unfolding as a zigzag Elliott Wave structure. In this decline, wave (a) ended at 6888.76, wave (b) rebounded to 6913.71, and wave (c) dropped to 6824.31, thereby completing wave ((iv)). The S&P 500 has since resumed higher in wave ((v)). From wave ((iv)), wave (i) advanced to 6965.69. A pullback in wave (ii) is anticipated, with buyers expected to emerge in three, seven, or eleven swings, supporting further upside potential.

S&P 500 (SPX) 45 minute chart from 01.07.2026 update

SPX Elliott Wave [Video]

Youtube preview

Author

Elliott Wave Forecast Team

Elliott Wave Forecast Team

ElliottWave-Forecast.com

More from Elliott Wave Forecast Team
Share:

Editor's Picks

GBP/USD bounces off lows, back above 1.3200

After bottoming out near 1.3160, GBP/USD manages to regain a bit of shine and reclaim the 1.3200 mark and beyond at the end of the week. Stronger-than-expected UK Retail Sales data seem to be helping the British Pound limit its losses, while the chaotic UK political environment keeps the bulls at bay for now.

EUR/USD looks consolidative around 1.1460

EUR/USD stages a modest rebound after slipping to a three-month low below 1.1420 at the end of the week. That said, the pair now looks to consolidate humble gains just above 1.1460 despite growing uncertainty surrounding the next round of US-Iran negotiations, which keeps the US Dollar’s downside contained.

Gold slips back to six-day lows, targets $4,100

Gold retreats for the third consecutive day on Friday, eroding gains seen in the first half of the week and approaching the key $4,100 mark per troy ounce. Indeed, the precious metal continues to face headwinds from the Fed's hawkish stance and renewed uncertainty surrounding the next round of US-Iran negotiations.

Solana extends correction despite ETF inflows, RWA adoption

Solana (SOL) price edges below $70 extending its losses for the fourth straight day this week. The institutional demand for Solana is building, with steady inflows so far this week and Morgan Stanley’s amended S-1 filing for a Solana-focused Exchange-Traded Fund.

The Iran war didn't break the US economy, but what happens next?

Nearly four months after the start of the Iran war, the US economy remains remarkably resilient. While the conflict initially triggered a severe disruption to global energy markets and a sharp rise in Oil prices, recent diplomatic progress between Washington and Tehran has eased concerns about a prolonged supply shock.

Regime change: Inside Kevin Warsh's first move to make the Fed unreadable on purpose

The rate did not move. That was the least interesting thing about Kevin Warsh's first meeting in charge of the Fed. The FOMC held its benchmark at 3.50%-3.75% for the fourth straight meeting, exactly as priced, and then the new chair used his first press conference to dismantle the machinery the market has leaned on for a decade.